Key Takeaways
- Bitcoin’s recent surge has drawn surprise as banking sector has pulled stock market down
- Declaring this a break in the correlation trend is a mistake, writes our Data Analyst Dan Ashmore, who says Bitcoin remains risk-on
- Both the stock market and Bitcoin continue to trade off interest rate expectations, aside from isolated episodes of systemic risk to Bitcoin, the numbers show
- Recent week shows a slightly softer relationship than normal, amounting to a less dramatic a less dramatic version of the price action around the FTX and Celsius collapses in 2022
- Normal correlation bound to be resumed soon, our data shows
One of the dominant storylines over the last year or two so has been the incredibly tight relationship between Bitcoin and the stock market.
We will get into the numbers shortly, but the mantra is that when the stock market jumps, Bitcoin jumps more. When the stock market falls, Bitcoin falls more. That is the bottom line. But is it true still true?
Some market participants are starting to think that this relationship is shifting, especially given events of the past week. The word “uncorrelated” is thrown around a lot in markets, and now some are saying Bitcoin is making progress towards that status. I’m not so sure that is correct.
Correlation has been high since 2022 started
Let us first look back over the price action from the start of 2022, which more or less marked the stock market peak.
I’ll get deeper in the next section, but the best way to kick off an assessment of correlation is by the old-fashioned eye test. Let’s begin by charting Bitcoin’s returns against the Nasdaq since the start of 2022:
It is immediately clear that there is a strong pattern here.
Before looking at correlation coefficients, by looking at the respective price action we can see that the assets have been in lockstep aside from two (visually notable) periods. The first is August 2022, when Bitcoin lagged behind the Nasdaq’s gains. It still gained, but it was outperformed by the Nasdaq – uncommon for periods of expansion. This was shortly after the contagion crisis sparked by Celsius (it filed for bankruptcy in mid-July).
The second period of divergence that jumps out is a much more noticeable one – November 2022. As the Nasdaq surged off softer inflation readings and optimism on interest rate policy, Bitcoin fell. Not only that, but it fell dramatically, down from $20,000 to $15,000. Of course, this was thanks to Sam Bankman-Fried and the FTX collapse, a bearish shock specific to crypto, much like Celsius was.
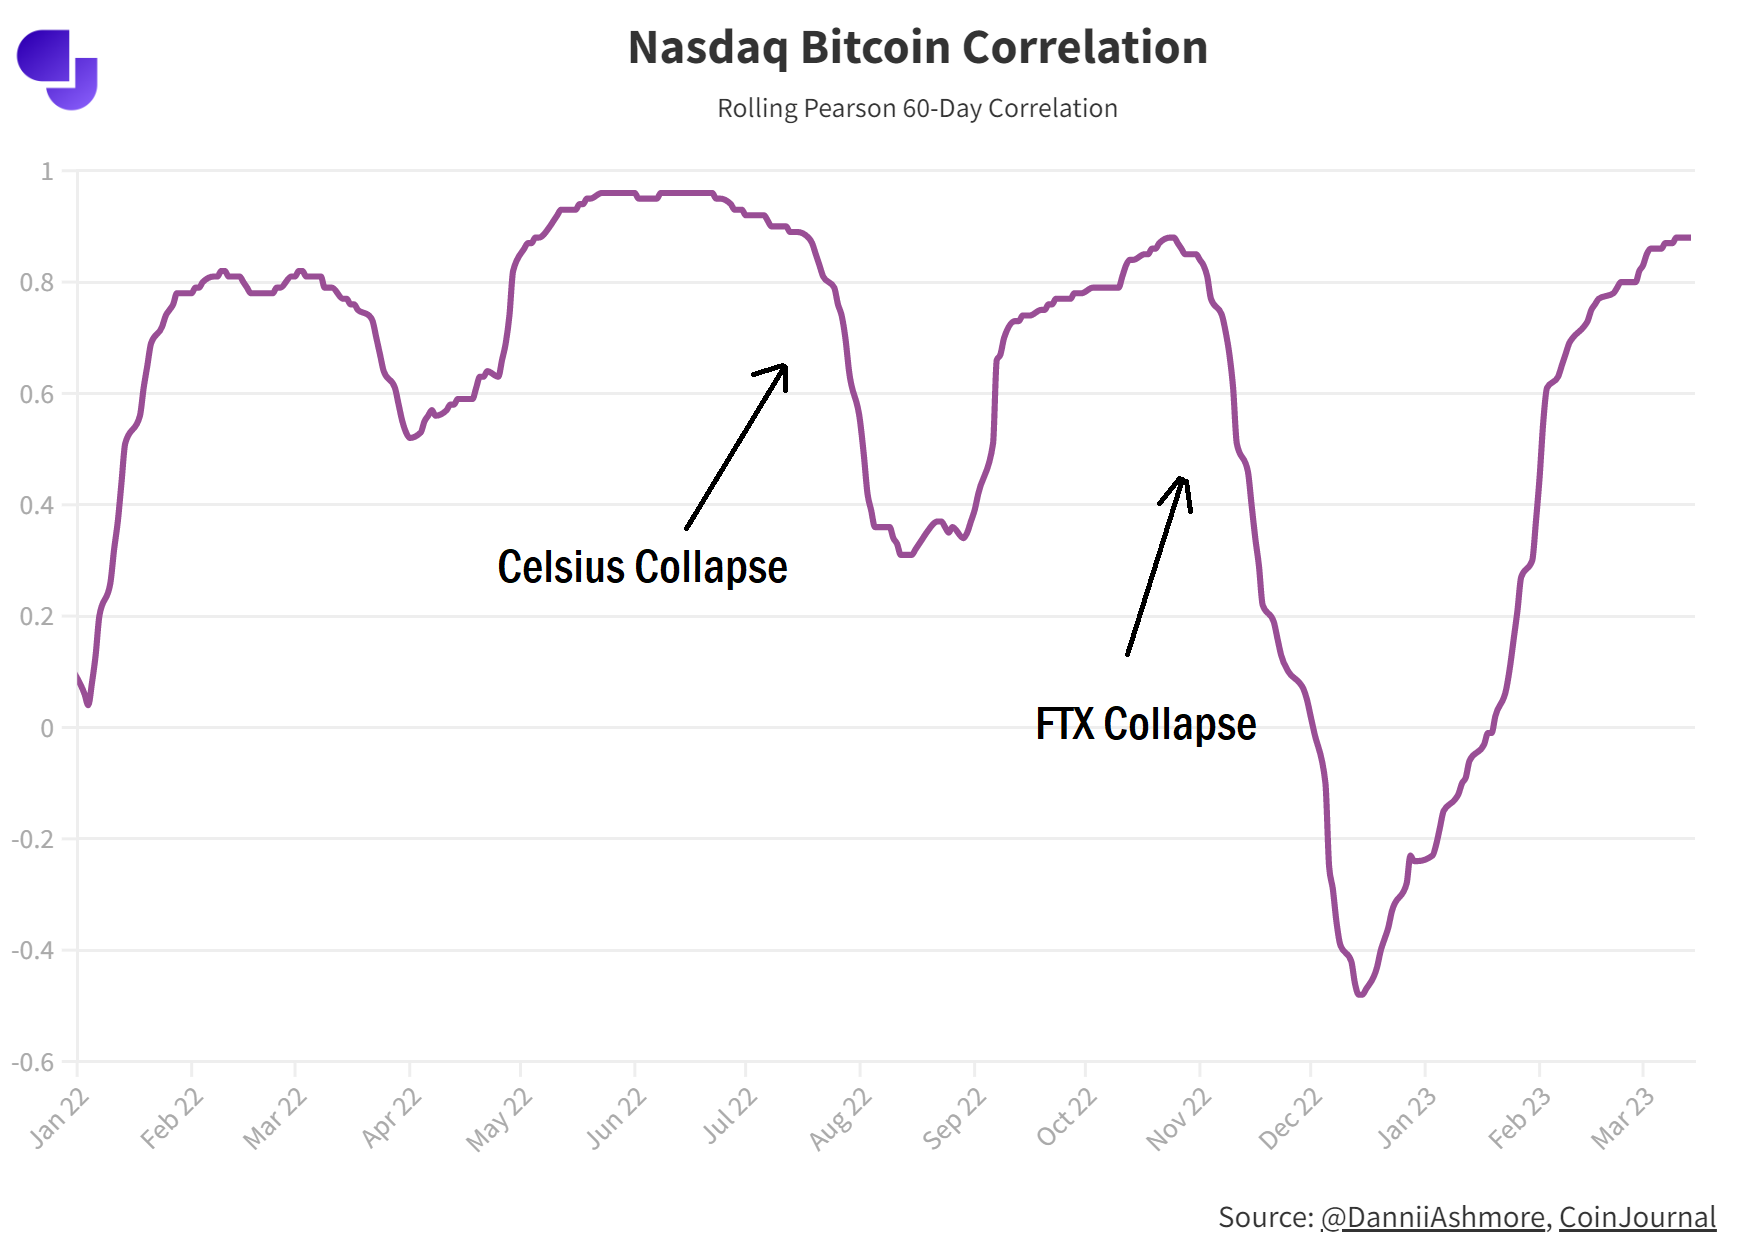
Let’s now graph the correlation itself. I won’t get too deep on the math, but I have used the 60-Day Pearson indicator and rolled it back to the start of 2022.
The results more or less back up what we discussed above. For the uninitiated, a correlation of 1 means a perfect relationship (the word count of this article and the number of words I have written this month, for example) while a correlation of 0 means no relationship (such as my word count per month and the number of T-Rexs spotted in New York City).
Celsius and FTX collapses are clear below, while the other dip occurs around the time of LUNA (the stock market also fell around this time as we transitioned to high interest rate policy).
Correlation can be misleading
This shows correlation, but not necessarily causation. My old maths teacher had a great way of explaining this difference. Shark bites and ice cream purchases may be correlated, but nobody would argue that digging into Ben and Jerries makes you more likely to be hunted by a great white shark.
Instead, there is a lurking variable. In this case, on sunnier days, people are more likely to both swim at the beach and buy ice cream, and it is the swimming rather than the ice cream that makes a shark bite more likely. Swimming is the lurking variable.
While that example is exaggerated (shark bites are extremely rare, in case I’m arising a phobia of yours!), the point is a good one. In financial markets, we have another lurking variable. In truth, we have lots of them – there are an imaginable amount of variables that affect the stock market – but the big one this past year has been the Federal Reserve and its interest rate policy.
It is not the stock market that is causing Bitcoin to move, it is interest rate policy causing both the stock market and Bitcoin to move. And in turn, expectations about inflation have been the key factor feeding into interest rate expectations. This is why we have seen repeatedly big movements around CPI announcements and Fed meetings.
There is a saying, “correlations of risk assets go to 1 in times of crisis”. And when we transitioned into a new interest rate paradigm in April 2022, when it became clear inflation was rampant, that is exactly what happened.
All risk assets sold off, including both stocks and equities. Bitcoin, being more volatile, of course sold off more. And since then, bar the aforementioned episodes, the correlation has held.
Is the correlation falling?
The big question is whether this correlation is falling. Indeed, that is the ultimate vision for Bitcoin. An uncorrelated store of value, akin to a digital form of gold.
Some have looked at the price action of the past week or two and declared that this means we are seeing a lower correlation. But I think this is simply a smaller version of what we saw during the Celsius and FTX “decouplings”. A short-term dip in correlation in response to a specific event.
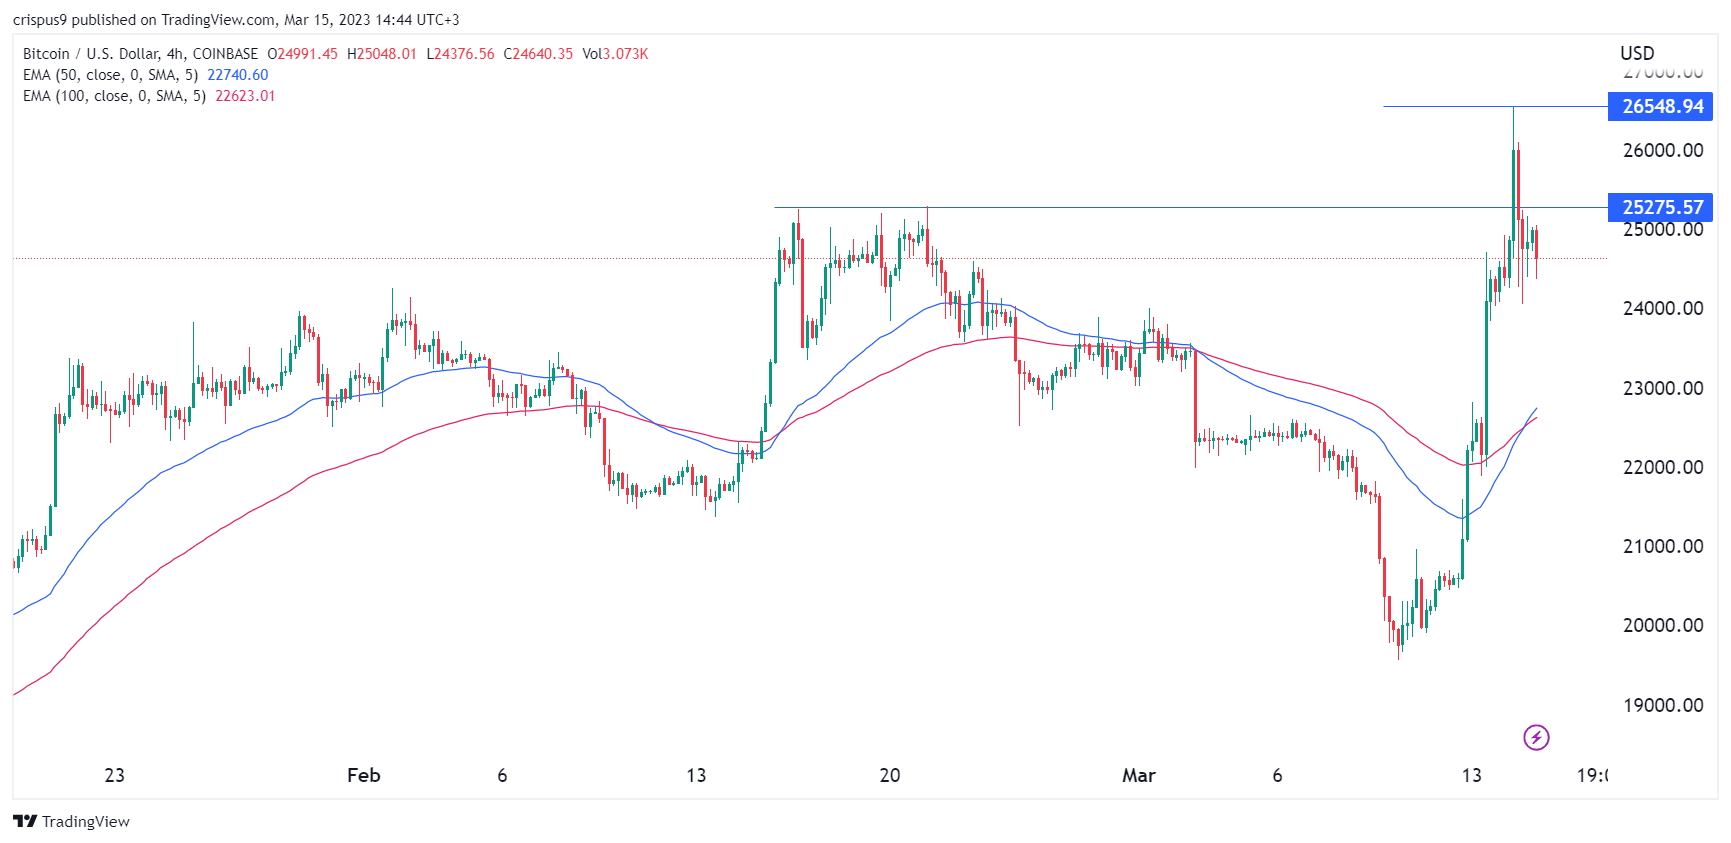
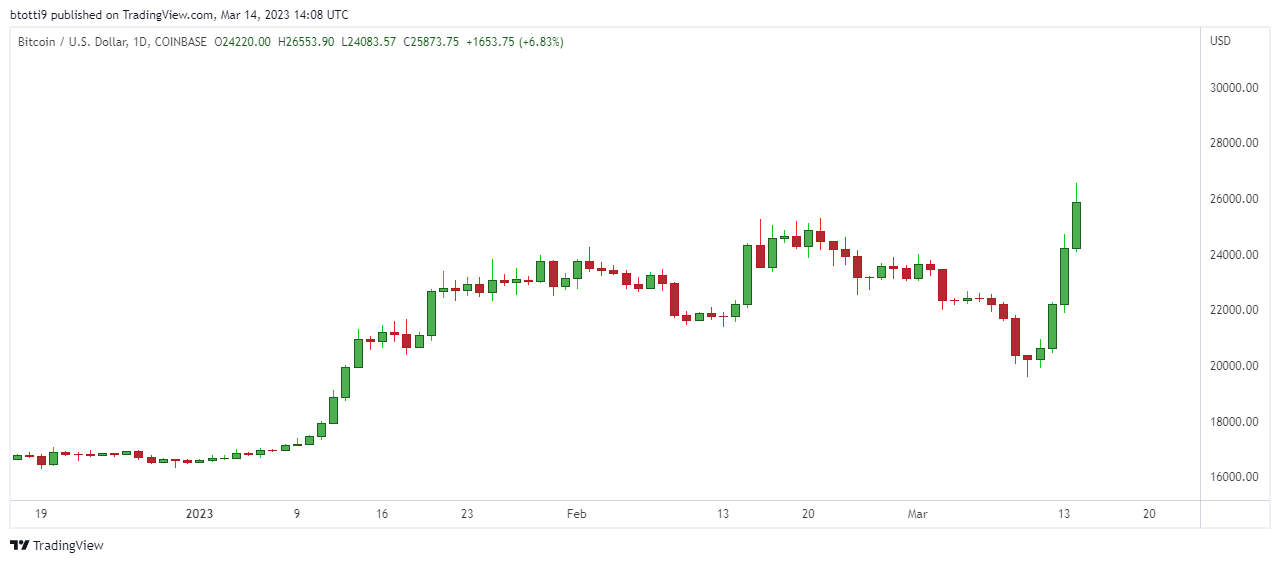
Bitcoin sold off drastically in the wake of the Silicon Valley Bank (SVB) troubles, before rebounding sharply once the US administration announced it was stepping in to guarantee deposits.
The stock market, on the other hand, also sold off but to a far lesser degree. And then with the banking turmoil striking Europe yesterday, Bitcoin held firm while markets wobbled. The declaration was that this must mean the famous decoupling is taking place.
I believe this is a fallacy and I think the numbers agree.
Bitcoin first sold off aggressively because SVB had the potential to be a crisis on the scale of Celsius and FTX, as Circle, the issuer of the world’s second-biggest stablecoin, USDC, holds $3.3 billion of reserves in the bank (and the original fear was that it may hold more, before the number was clarified).
USDC hence depegged, falling to below 90 cents on many exchanges. Obviously, a USDC collapse would have been harrowing for the industry and hence Bitcoin plummeted, falling to around $20,000.
While SVB presented an ominous threat to financial markets as a whole, the danger within cryptocurrency was elevated because of the importance of USDC to the industry, especially following the shutdown of BUSD last month.
With 25% of Circle’s reserves in cash, there was fear of insolvency until it was clarified that only 8.25% of reserves were held in SVB, before the US administration stepped in to guarantee deposits in any case.
Once this fear was over, Bitcoin rallied back, reversing the fall when the crisis came to light. But stocks didn’t jump to the same extent. This makes sense.
Besides, the price action was not all that dramatic and the supposed “decoupling” was hardly drastic. European banks were hit Wednesday, but Thursday has largely seen a rebound, while on a whole, the stock market is doing just fine, showing moderate gains.
Looking at the correlation metric, it has barely moved over a longer time frame such as 60-day, and is already bouncing back. The 30-day metric shows more movement, but as with any smaller sample size, is always more volatile and less indicative. Both metrics already appear to be bouncing back in any case.
Whatever way you swing it, a simple glance at the previously mentioned chart comparing the Nasdaq to Bitcoin is all you need to know. Bitcoin is trading like an extreme-risk asset, and that much is quite clear.
The trillion dollar question is whether this will change in the future. Can Bitcoin finally decouple from risk assets and establish itself as an uncorrelated store of value? Can it become a true hedge asset?
That may happen one day. But it hasn’t happened yet.
Share this article
Categories
Tags