Tag: Technical Analysis

  • SHIB could rally another 20% based on these factors

    SHIB could rally another 20% based on these factors

    Shiba Inu price took the market by surprise as a 20% rally unfolded early in the week. Key levels have been identified to gauge a potential entry before the uptrend continues.  

    Shiba Inu price could rally higher

    Shiba Inu price rallied in applaudable fashion as the notorious meme coin pulled off a stunning 20% rally. At the current time, the bears have entered the market, forging an 8% decline. Still, there are reasons to believe the uptrend move is still ongoing. 

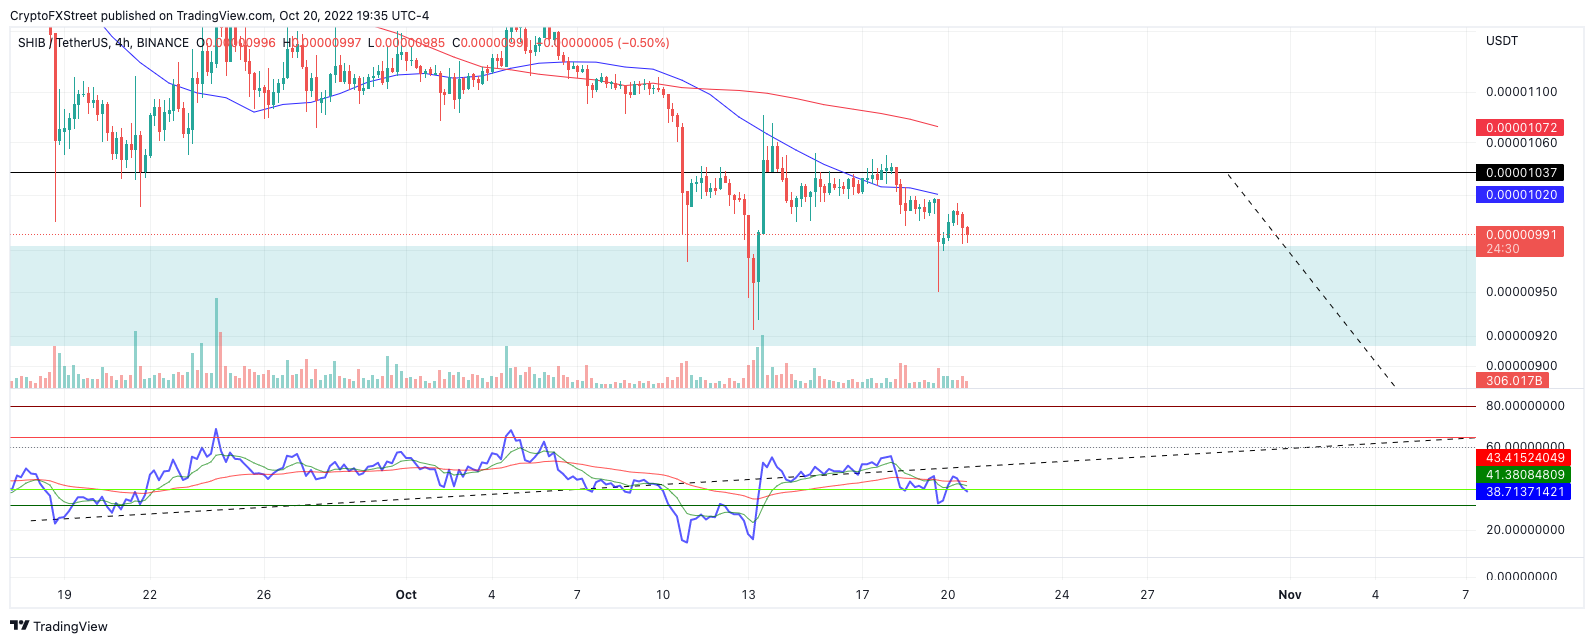
    Shiiba Inu price currently auctions at $0.00001089. During the recent upswing, the bulls have breached both the 8-day exponential and 21-day simple moving averages. Now, the two trend indicators converge under the SHIB price, which signals bullish strength.

    tm/shib/10/27/22

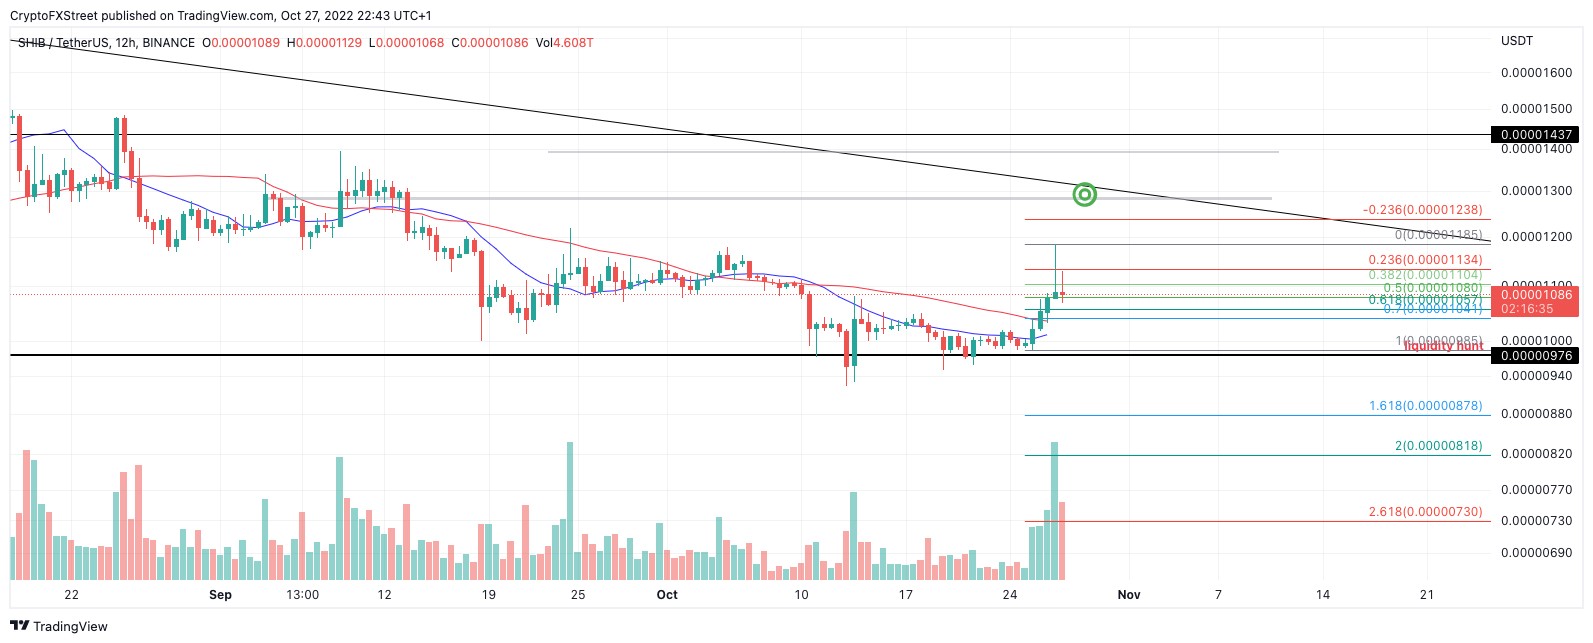
    SHIB/USDT 12-Hour Chart

    A Fibonacci retracement tool surrounding the strongest part of the recent rally suggests the current profit-taking consolidation is just a 50% retracement. If market conditions persist, a bullish cross of the indicators could prompt an additional 20% rally. Key bullish targets would be $0.00001250 and potentially $0.00001300.

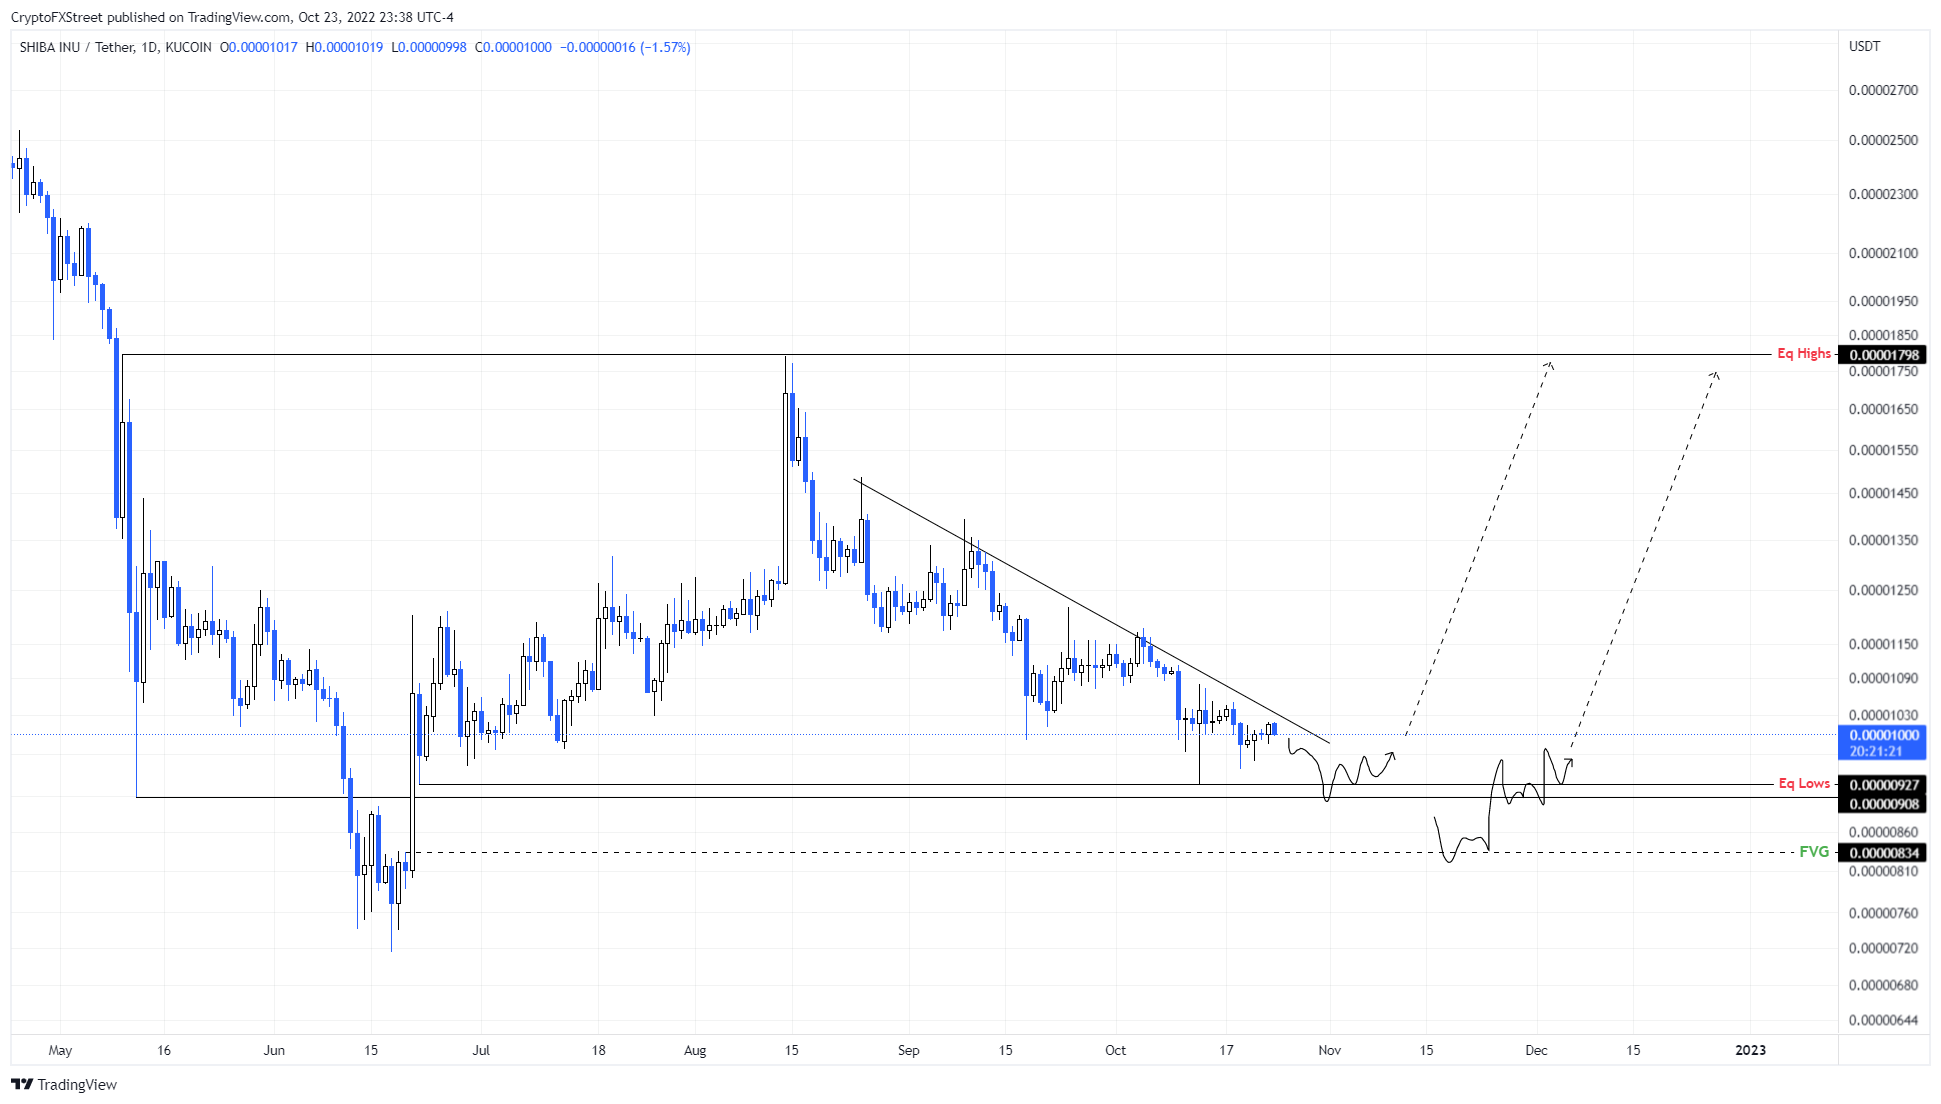
    Invalidation of the bullish thesis could occur if the bears manage to tag the $0.00001040 liquidity zone. A sweep of the low could trigger a mudslide rally toward $0.00000970. The price of Shiba Inu would decline by 11% if the invalidation scenario occurred. 

    In the following video, our analysts deep dive into the price action of Shiba Inu, analyzing key levels of interest in the market. -FXStreet Team


    Source link

  • Litecoin, Shiba Inu & Bitcoin – American Wrap 25 October

    Litecoin, Shiba Inu & Bitcoin – American Wrap 25 October

    Litecoin price takes off! Is this the beginning of Crypto Season?

    Litecoin price has taken the market by a stunning surprise as the bulls have taken complete control of the trend prompting a 7% rally. The move was catalyzed by a classic retest and all signals from the 21-day simple moving average. Litecoin price currently auctions at $56 as the bulls have successfully taken out the October high. Now the only question is when will the uptrend pull back?

    Bitcoin price: Will BTC break $28,500 after record-breaking period of low volatility?

    Analysts at crypto intelligence tracker Glassnode argue that Bitcoin’s volatility has hit historical lows and a breakout in BTC is likely. Evaluating both the bullish and bearish scenario for Bitcoin price, analysts noted a conviction among BTC holders in the bear market. 

    Shiba Inu price: SHIB prepares to eat one zero after burn rate jumps up 1,494%

    Shiba Inu’s burn rate has climbed 1,494% – a significant increase over the past 24 hours. Based on data from the portal that tracks Shiba Inu’s burn implementation and statistics, Shibburn, the pace of SHIB token destruction has picked up. Normally a bullish factor, the exponential increase in the burn rate is a reaction to SHIB price’s recent weakness, and holders are hopeful it will have a reversal effect.


    Source link

  • Bitcoin, Ethereum and Shiba Inu – European Wrap 24 October

    Bitcoin price has been consolidating over the weekend, albeit triggering a minor rally. This move continues to be undone as sellers offload their holdings. But the bullish move over the weekend could be an indication of more positive developments to come.


    BTC/USD 1-day chart

    Ethereum (ETH) price action is set to jump between 7% on the low side and 28% by a more generous calculation, according to price targets established for the end of the week. As the dust settles over recent events, traders are reassessing the situation and it is becoming clear two key factors are dictating the future path of trading. The first is company earnings this week and the second, how the UK political situation unfolds. These will determine how far ETH price action could rally.


     ETH/USD Daily chart

    Shiba Inu price remains bearish with no clear signs of a bullish attempt to recover. Moreover, the inefficiencies hint at a further move down south, bringing more pain to SHIB holders. 


    SHIB/USDT 4-hour chart


    Source link

  • Two levels to accumulate SHIB for maximum returns

    Two levels to accumulate SHIB for maximum returns

    • Shiba Inu price has been stuck below a declining trend line since August 25 and is having trouble forming a base.
    • A sweep of the equal lows at $0.0000092 or a retest of the FVG at $0.0000083 will be two significant places to accumulate SHIB.
    • A daily candlestick close below $0.0000077 will break the bullish market structure and invalidate the optimistic outlook. 

    Shiba Inu price remains bearish with no clear signs of a bullish attempt to recover. Moreover, the inefficiencies hint at a further move down south, bringing more pain to SHIB holders. 

    Shiba Inu price needs another haircut

    Shiba Inu price set up the second swing high at $0.0000179 on August 14, creating an equal high. Since then, SHIB has produced lower highs and lower lows, indicating the persistence of a clear bearish trend.

    The dog-themed cryptocurrency is currently hovering above the $0.0000092 support level and the equal lows at $0.0000090. A slight spike in selling pressure coupled with a bearish Bitcoin outlook could send Shiba Inu price spiraling lower.

    A sweep of the sell-stop liquidity below $0.0000090 is a good place to accumulate SHIB tokens at a discount. However, investors should note that a further descent to fill the inefficiency at $0.0000083 is also possible.

    Hence, these two areas are points of interest for investors looking to play the meme coin rally. Market participants should note that the liquidity resting above the equal highs at $0.0000179 is a good reason for Shiba Inu price to rally towards.

    This move will allow market markers to collect the buy-stop liquidity resting above this. Hence, this trade is a long-term swing position and is unlikely to manifest in a few days.

    SHIB/USDT 4-hour chart

    SHIB/USDT 4-hour chart

    On the other hand, if Shiba Inu price fails to bounce at $0.0000090 and $0.0000083, it will retest the $0.0000077 support floor.

    If buyers fail to step up here and allow sellers to produce a daily candlestick close below it, the bullish thesis will face invalidation. In such a case, SHIB could continue its descent and retest the $0.0000060 level. 


    Source link

  • Is SHIB the best crypto to short?

    Is SHIB the best crypto to short?

    • Shiba Inu price has lost 6% of market value during this week’s decline.
    • SHIB has breached extremely oversold levels on the Relative Strength Index and shows a newly established bearish divergence.
    • Invalidation of the bearish outlook is a breach above $0.00001040.

    Shiba Inu price hints that a strong downtrend move is underway. Key levels have been identified to gauge the strength of the bears.

    Shiba Inu price continues to decline

    Shiba Inu price has become a problematic digital asset to hold as the notorious meme continues to lose market value throughout October. The bulls have lost support from the $0.00001000 level, and there is no evidence to believe the downtrend is ready to end.

    During the third trading week of October, the bears caused a 6% loss in market value. The decrease in price was catalyzed by the bears’ rejection from the 8-day exponential moving average on Sunday, October 9.

    Shiiba Inu price currently auctions at $0.00000989. The Relative Strength Index is back in oversold territory and has produced a bearish divergence between the last two countertrend retaliations. If the technicals are correct, SHIB investors could face serious pain. The bearish targets lie at $0.00000900 and $0.00000750. If these levels do not hold, a breach into $0.00000700 is very likely. Such a move would result in a 30% decline.

    tm/shib.10/20/22

    SHIB USDT 4-Hour Chart

    Invalidation of the bearish thesis could occur if the bulls re-hurdle the $0.00001040 liquidity zone. A spike through the prior resistance area could trigger a countertrend rally toward the 21-day simple moving average at $0.0001074. The price of Shiba Inu will rise by 10% if the invalidation scenario occurs.


    Source link