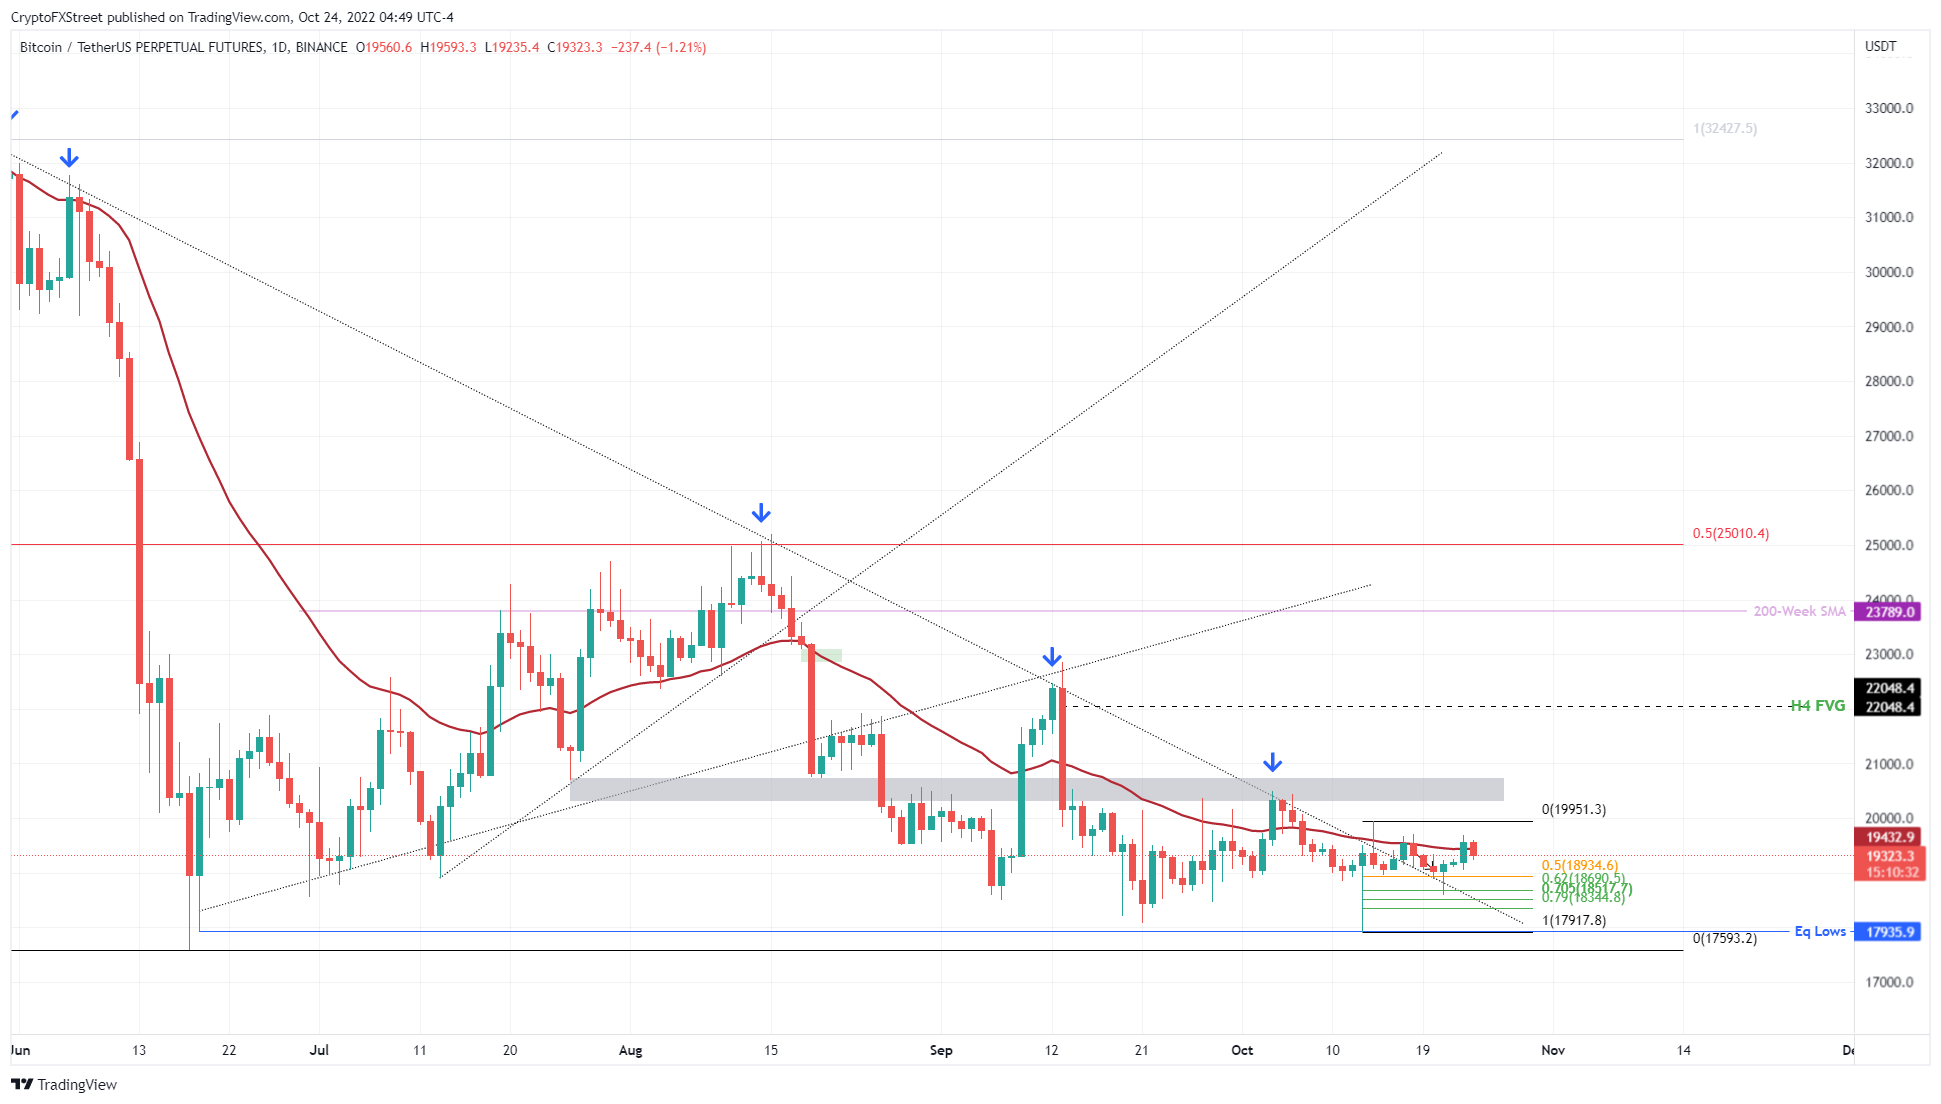
Bitcoin price has been consolidating over the weekend, albeit triggering a minor rally. This move continues to be undone as sellers offload their holdings. But the bullish move over the weekend could be an indication of more positive developments to come.
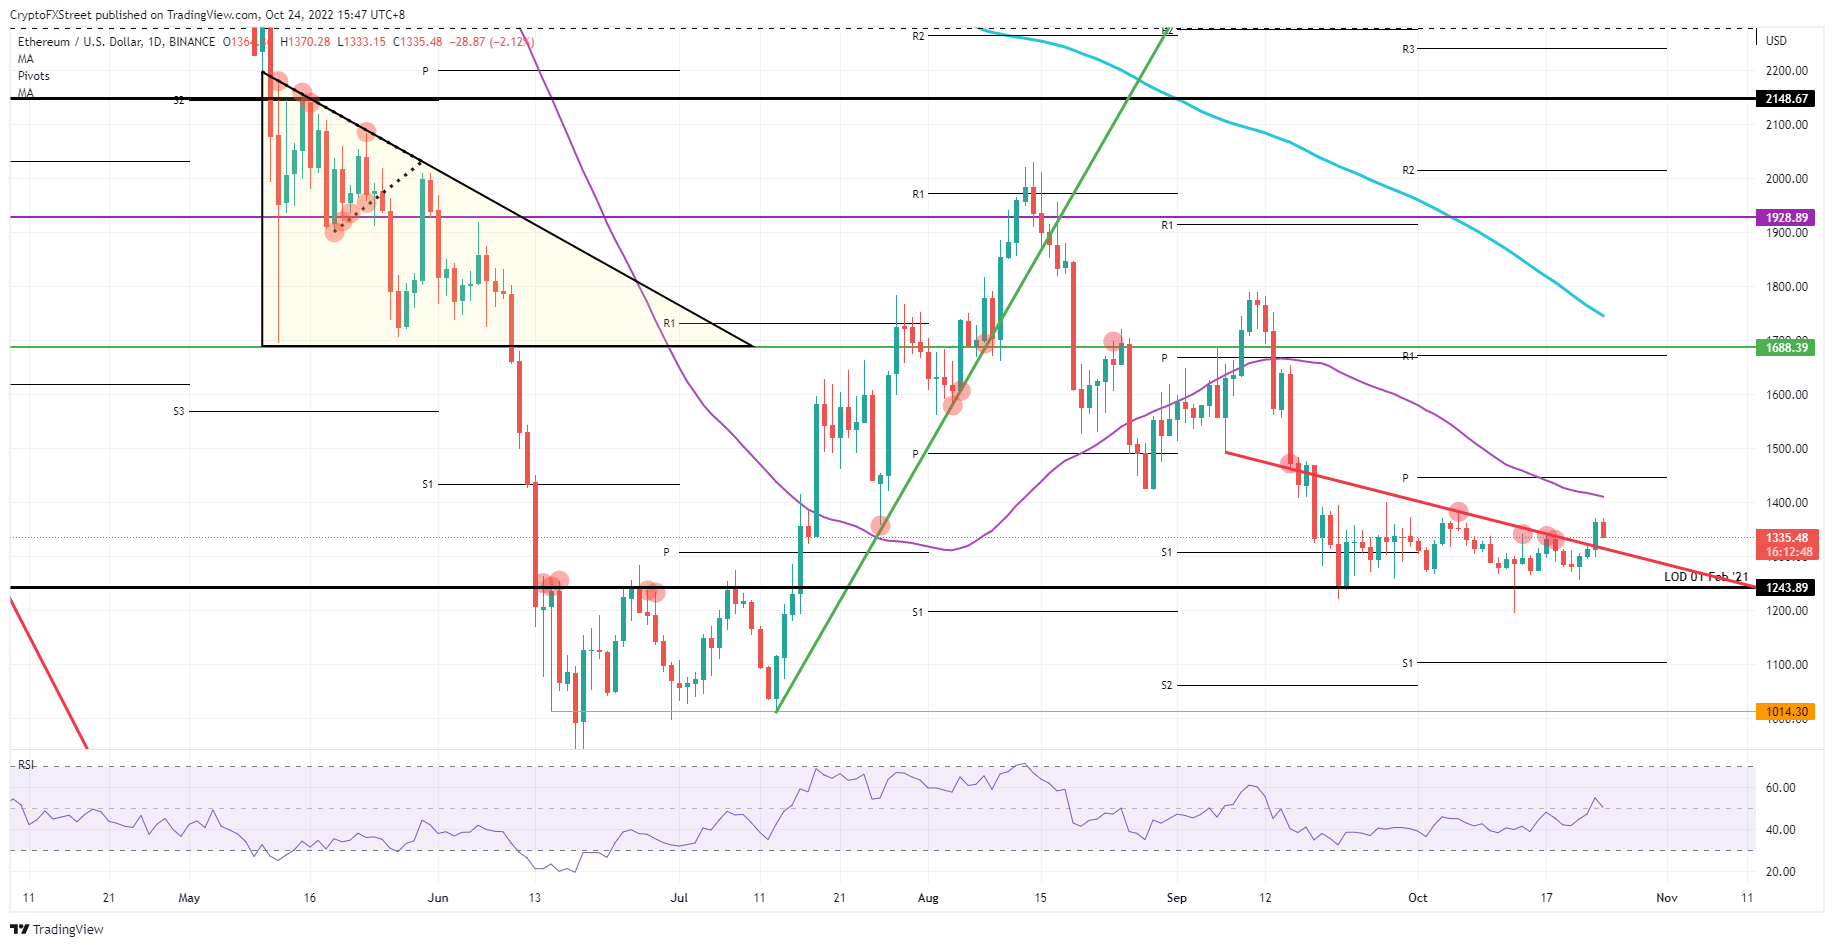
Ethereum (ETH) price action is set to jump between 7% on the low side and 28% by a more generous calculation, according to price targets established for the end of the week. As the dust settles over recent events, traders are reassessing the situation and it is becoming clear two key factors are dictating the future path of trading. The first is company earnings this week and the second, how the UK political situation unfolds. These will determine how far ETH price action could rally.
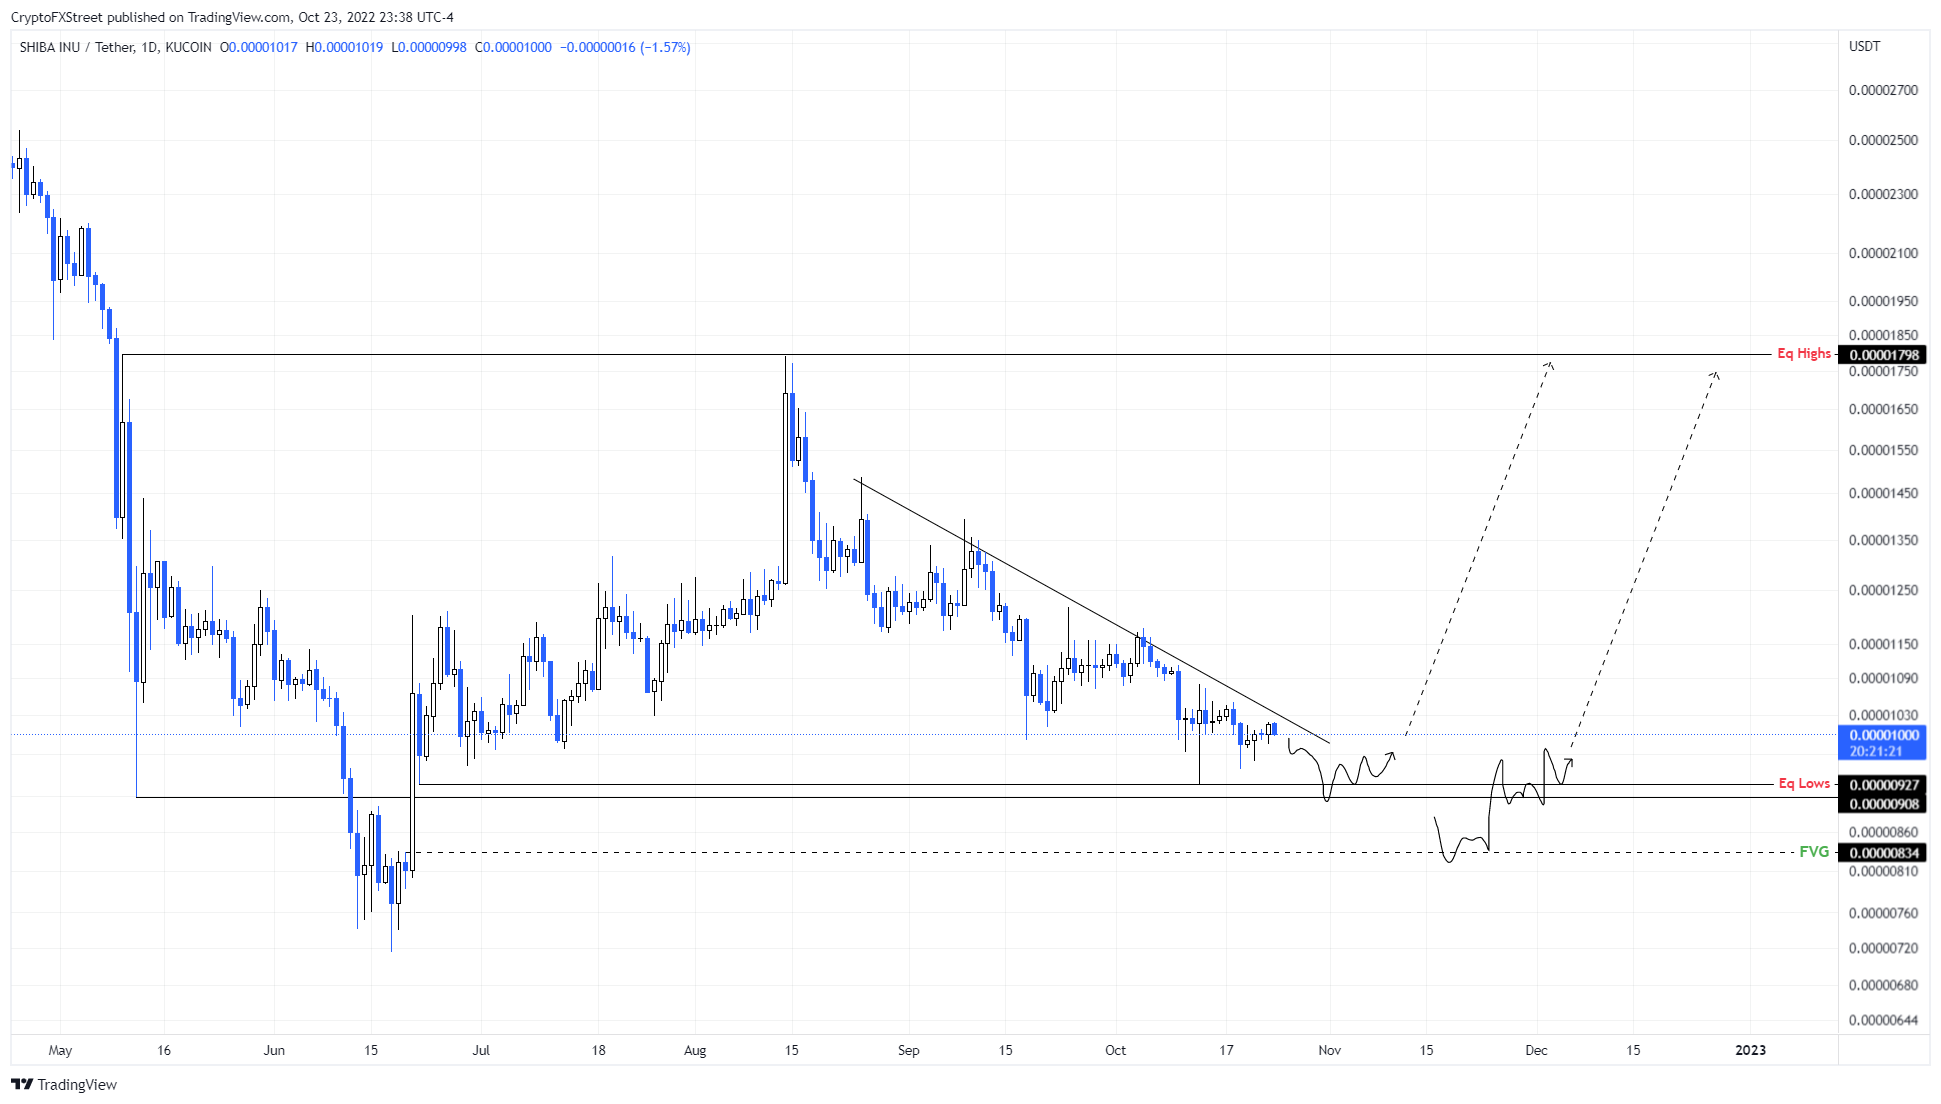
Shiba Inu price remains bearish with no clear signs of a bullish attempt to recover. Moreover, the inefficiencies hint at a further move down south, bringing more pain to SHIB holders.