Something which is always interesting is assessing the mining activity on Bitcoin, especially in conjunction with what is happening the price and the wider market.
After all, miners are the group who receive those freshly minted bitcoins as the blockchain continues to grow. Receiving this revenue in the native coin of the network means their actions can be indicative.
Something notable is happening at the moment though. The hash rate, which means the amount of computational power being spent by the Bitcoin network – i.e. the number of miners – is rising. And it’s rising a lot.
But at the same time, price is falling.
We are printing all-time high after all-time high in hash rate. The price, however, has cratered, before trading sideways over the last few months around this $20,000 level.
This is unusual. As the chart above shows, the last time we had a violent crash – May 2021 – the hash rate fell, too. This is natural – again, the revenue of these miners is Bitcoin, so why shouldn’t mining activity drop in response to a big price drop?
Instead, the hash rate – and the difficulty of the network – remains high. Most people say this is a good thing. And they’re right – the higher the hash rate, the more secure the network. And the more secure the network, the healthier Bitcoin is.
But does this make sense? Let’s look at this from an economic perspective. Are miners not selling as much as they should be? It seems as we crab sideways following this crash, miners are not letting up. You may point towards Ethereum’s switch to proof-of-stake in September as attracting more miners to Bitcoin, but the dates don’t really line up.
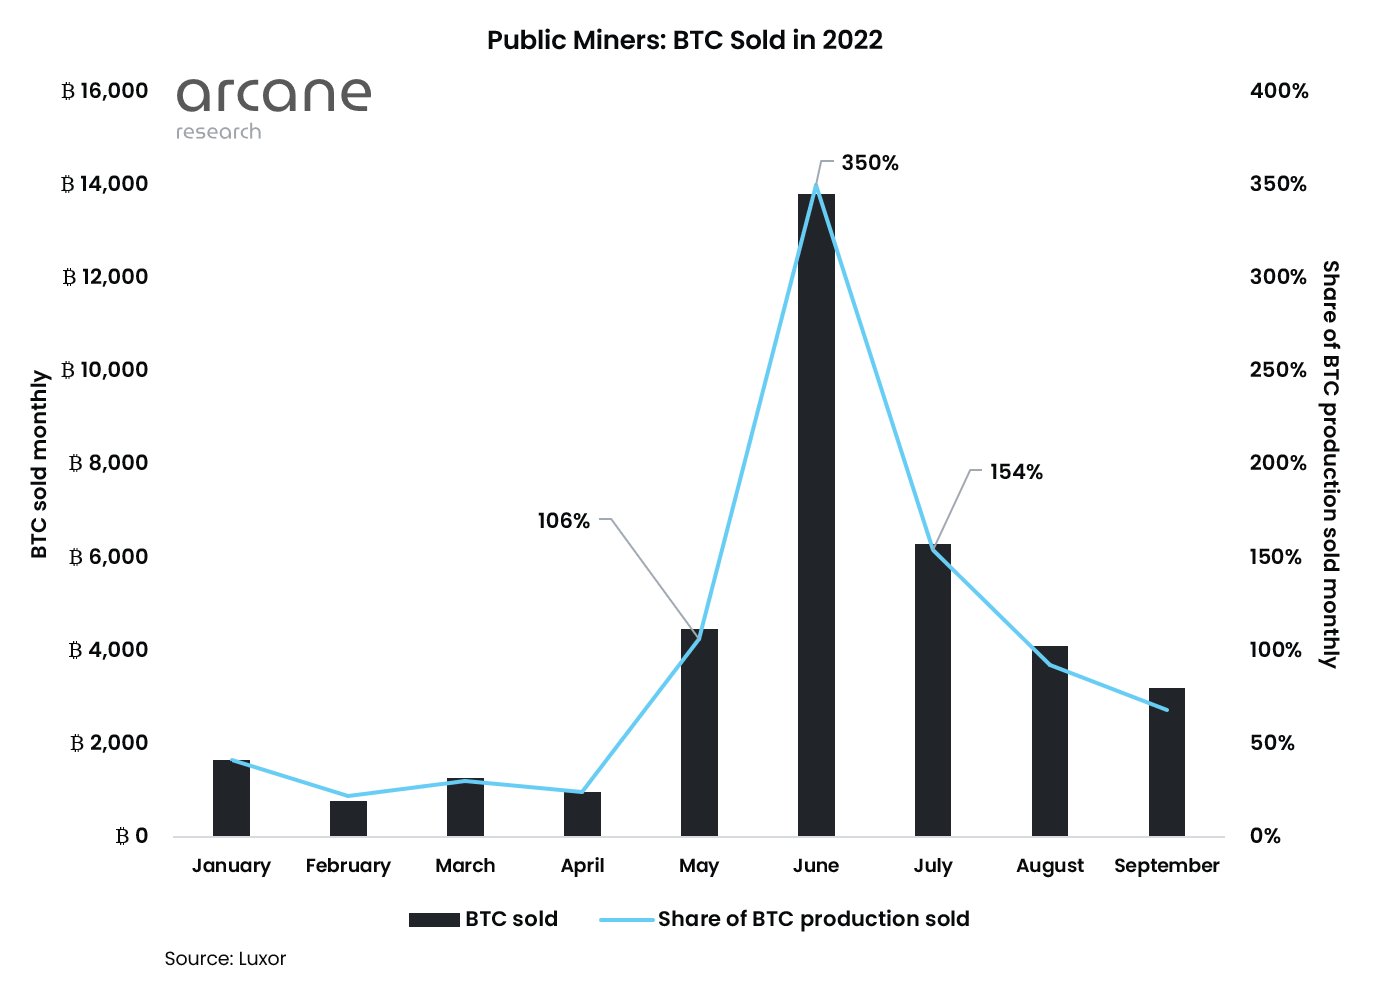
Let’s check if the miners are selling (graph via arcane research).

After the capitulation in the summer, they haven’t really been selling. But could this change soon?
I wrote recently about how I believe we could be one event away from a nasty red wick for Bitcoin. In looking at the underlying mining data, I get more nervous again. Again, this is far from certain – and more a hunch – but let us check the last time we had a hash rate rising with a falling price.
Mid 2018 this happened…and it wasn’t good.
Let us zoom in a little on this time period – the above chart is a bit hectic. In peering into the 2018 window, we see exactly how this same pumping price hash rate occurred despite the falling in price. And then look what happened the price in late 2018.
So that’s worrying. And there are people pointing this out as a bearish indicator. But as anyone who follows my analysis knows, I am not exactly comfortable with extrapolating past Bitcoin cycles to today.
Yes, this happened in 2018. But look at Bitcoin back then. Had you even heard of it? Because many hadn’t – it was still a niche asset, not yet making noise in the trad-fi world. Not to mention, the macro climate is entirely different today, with us squarely in a new interest rate paradigm. A point that should never be forgotten in looking at past cycles: none of those cycles happened while we were in the midst of a wider bear market in the economy.
But at the same time, it is not merely the fact this has happened before. For me, I am just a little puzzled that the selling of miners isn’t a bit higher here, or why the hash rate is mooning so aggressively.
So, in conclusion, this indicator is not causing me to run for the SELL button. But I do like using mining data in conjunction with my wider analysis, and it is a curious happening. And as I wrote last week, I do fear that this crab motion around $20,000 could end with a red wick. It’s a psychologically important level, and once we break hard below it, there is not much resistance.
There are too many variables in the wider market that could easily go south, and Bitcoin has not given up too much since the contagionary wave of the summer – stocks have actually been worse. This underlying mining activity is not quelling those concerns, even if it is not accentuating it.

Leave a Reply