
Bitcoin (BTC) treads water around $64,000 to start the week, but market participants see plenty of catalysts coming.
Key points:
- The US dollar is on the rebound, and history shows that Bitcoin rarely enjoys a strong DXY.
- July often does the opposite of June, and this forms the case for BTC price relief next.
- PCE inflation data is due out against a backdrop of uncertain US-Iran peace.
- Bitcoin’s relationship to oil prices is boosting the odds of $60,000 support holding.
- Short-term holders may have sold off, but whales are not interested in “capitulation” at current prices.
Bitcoin traders eye new US dollar challenge
A familiar headwind for Bitcoin price action is back in focus this week amid ongoing efforts to end the US-Iran war.
The US dollar index (DXY) is back above 100, and has hit its highest levels in over a year, per data from TradingView.
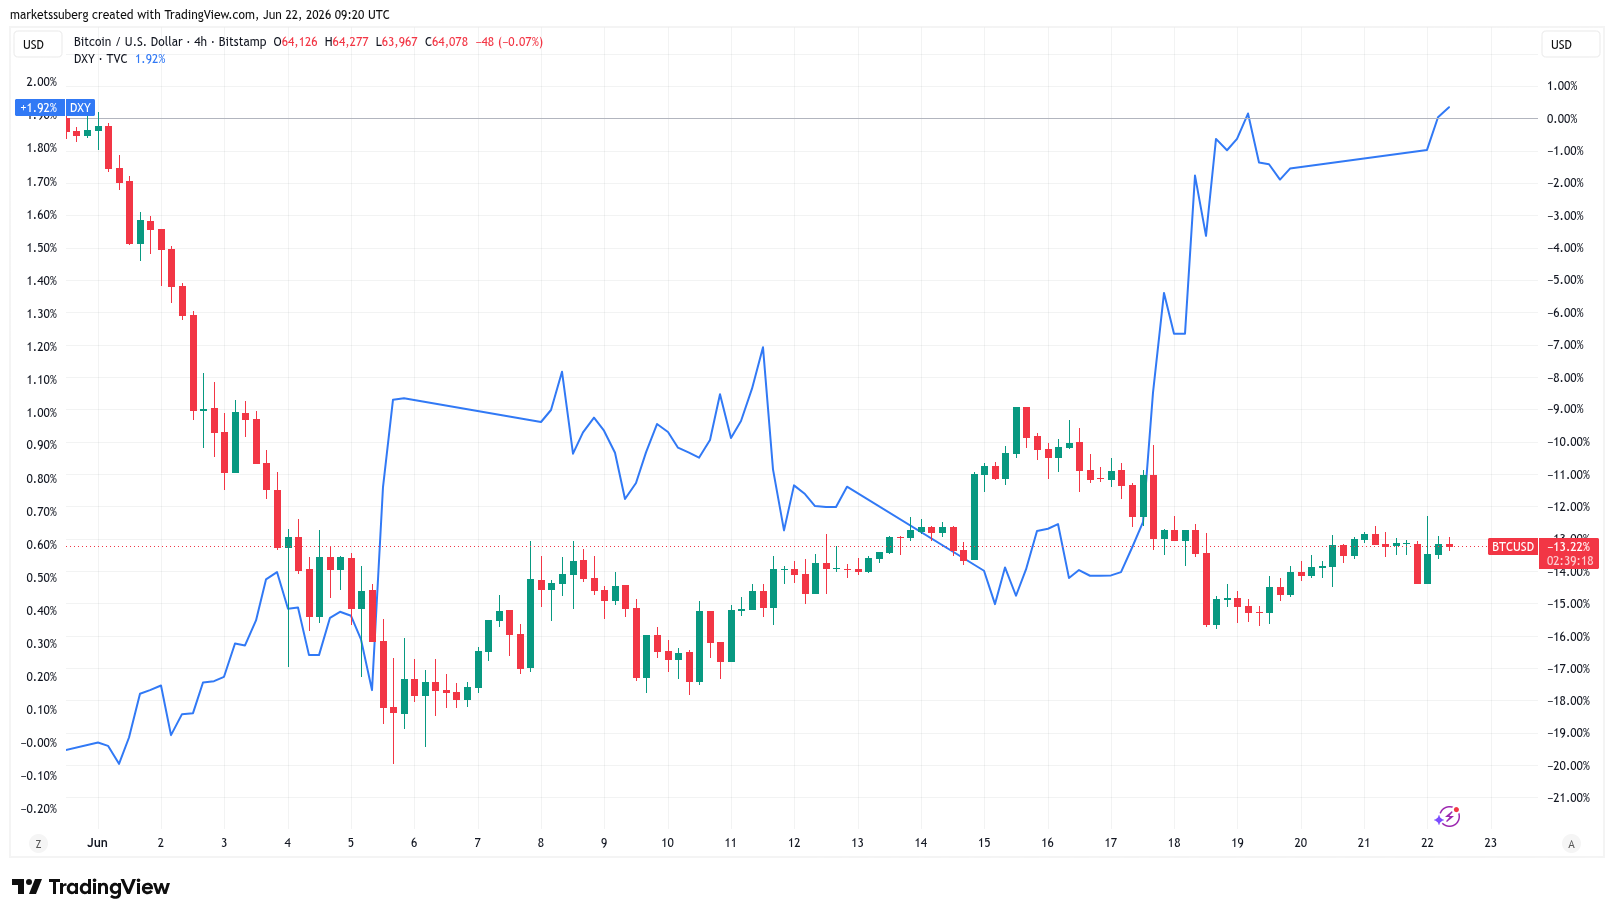
BTC/USD vs. US dollar index (DXY) four-hour chart. Source: Cointelegraph/TradingView
DXY, which measures dollar strength against a basket of US trading-partner currencies, is typically inversely correlated with crypto markets. Ongoing strength in the index thus poses a threat to broader upside in crypto and risk assets.
“Breaking the big 100 level while being supported by its Daily 200MA/EMA,” trader Daan Crypto Trades summarized in a post on X over the weekend, referring to the 200-day simple (SMA) and exponential (EMA) moving averages.
“If this ends up holding above 100, it would put some pressure on risk assets. So it’s good to watch.”
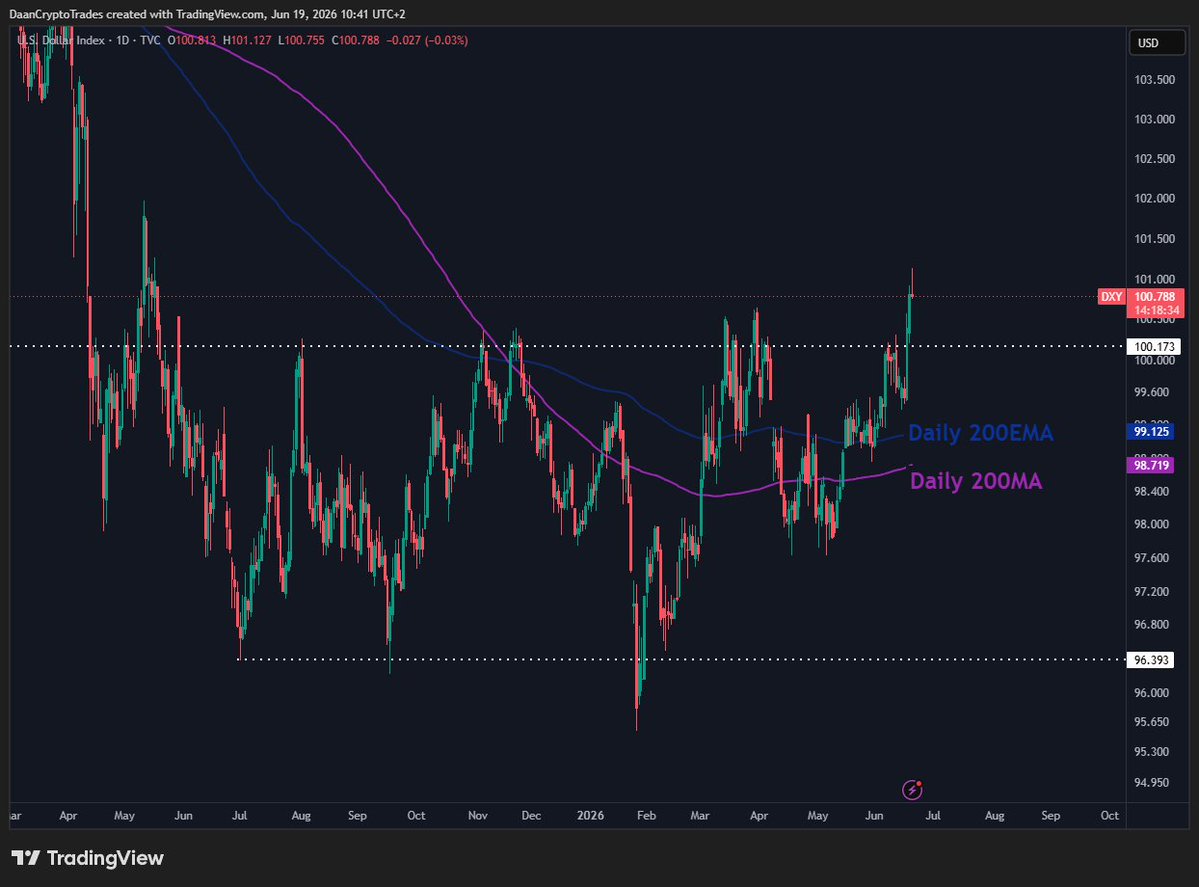
US dollar index (DXY) one-day chart. Source: Daan Crypto Trades/X
Trader Benjamin Cowen saw an ongoing DXY “bull case” into the latter half of 2026.
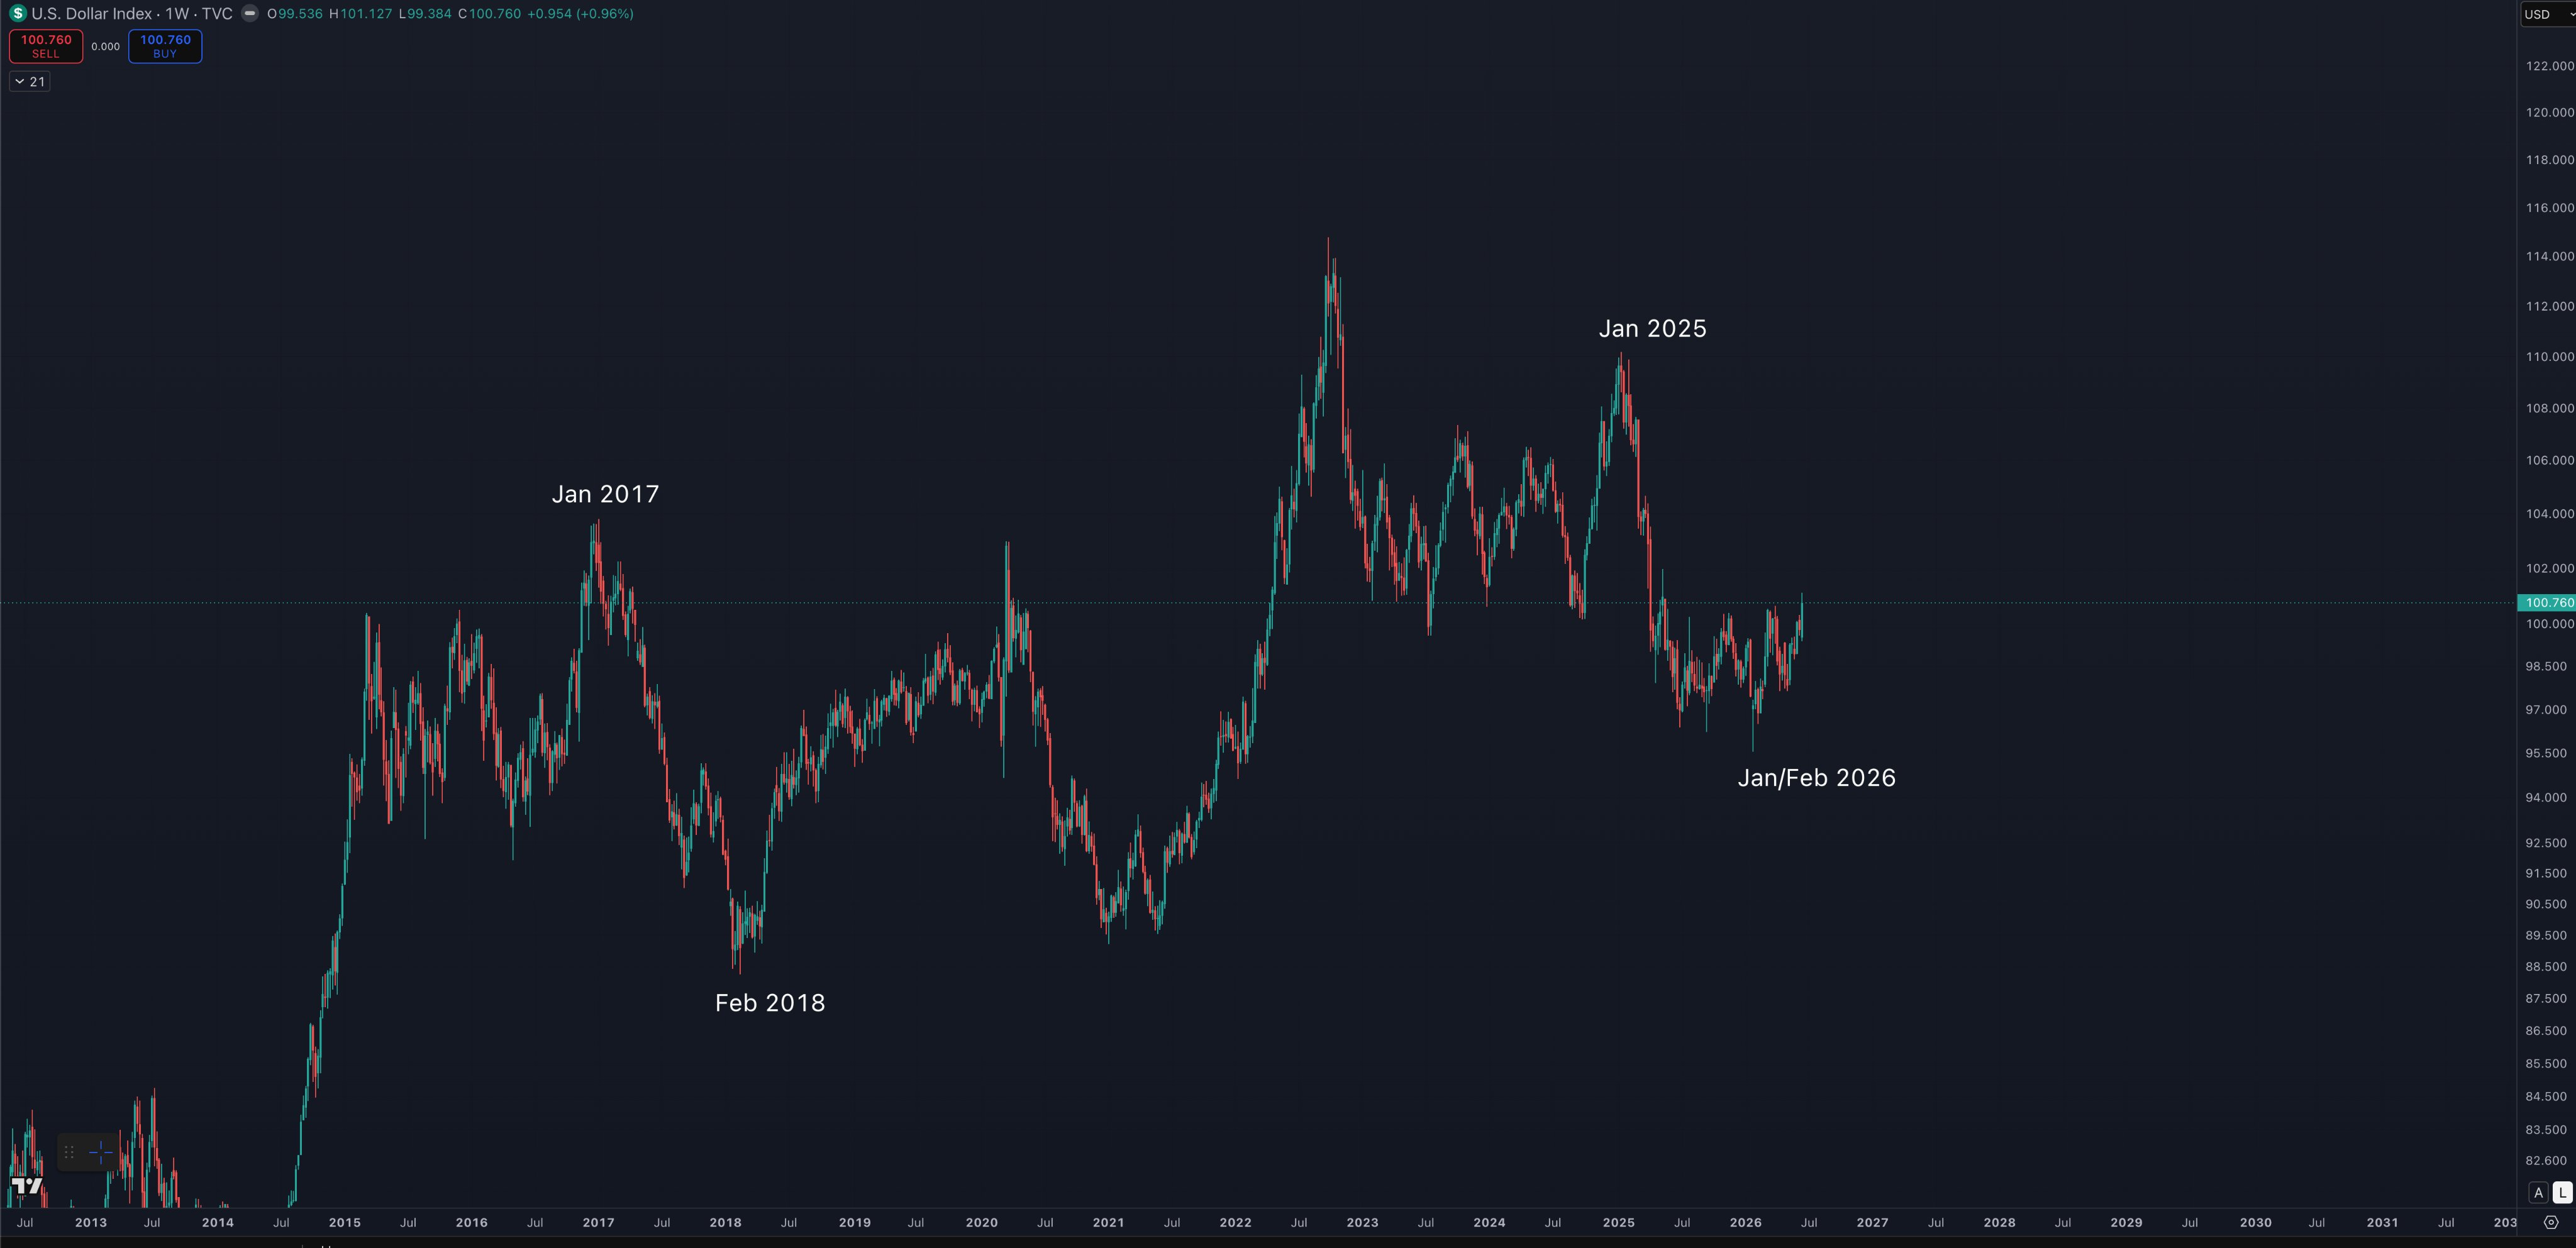
US dollar index (DXY) one-week chart. Source: Benjamin Cowen/X
“$DXY is currently testing the upper range of a megaphone aka broadening wedge pattern. If it breaks above this pattern instead of rejecting then that would be a pretty big upward target– somewhere around 106,” ColinTalksCrypto, creator of the YouTube channel of the same name, added.
“It would be bad for risk assets as well.”
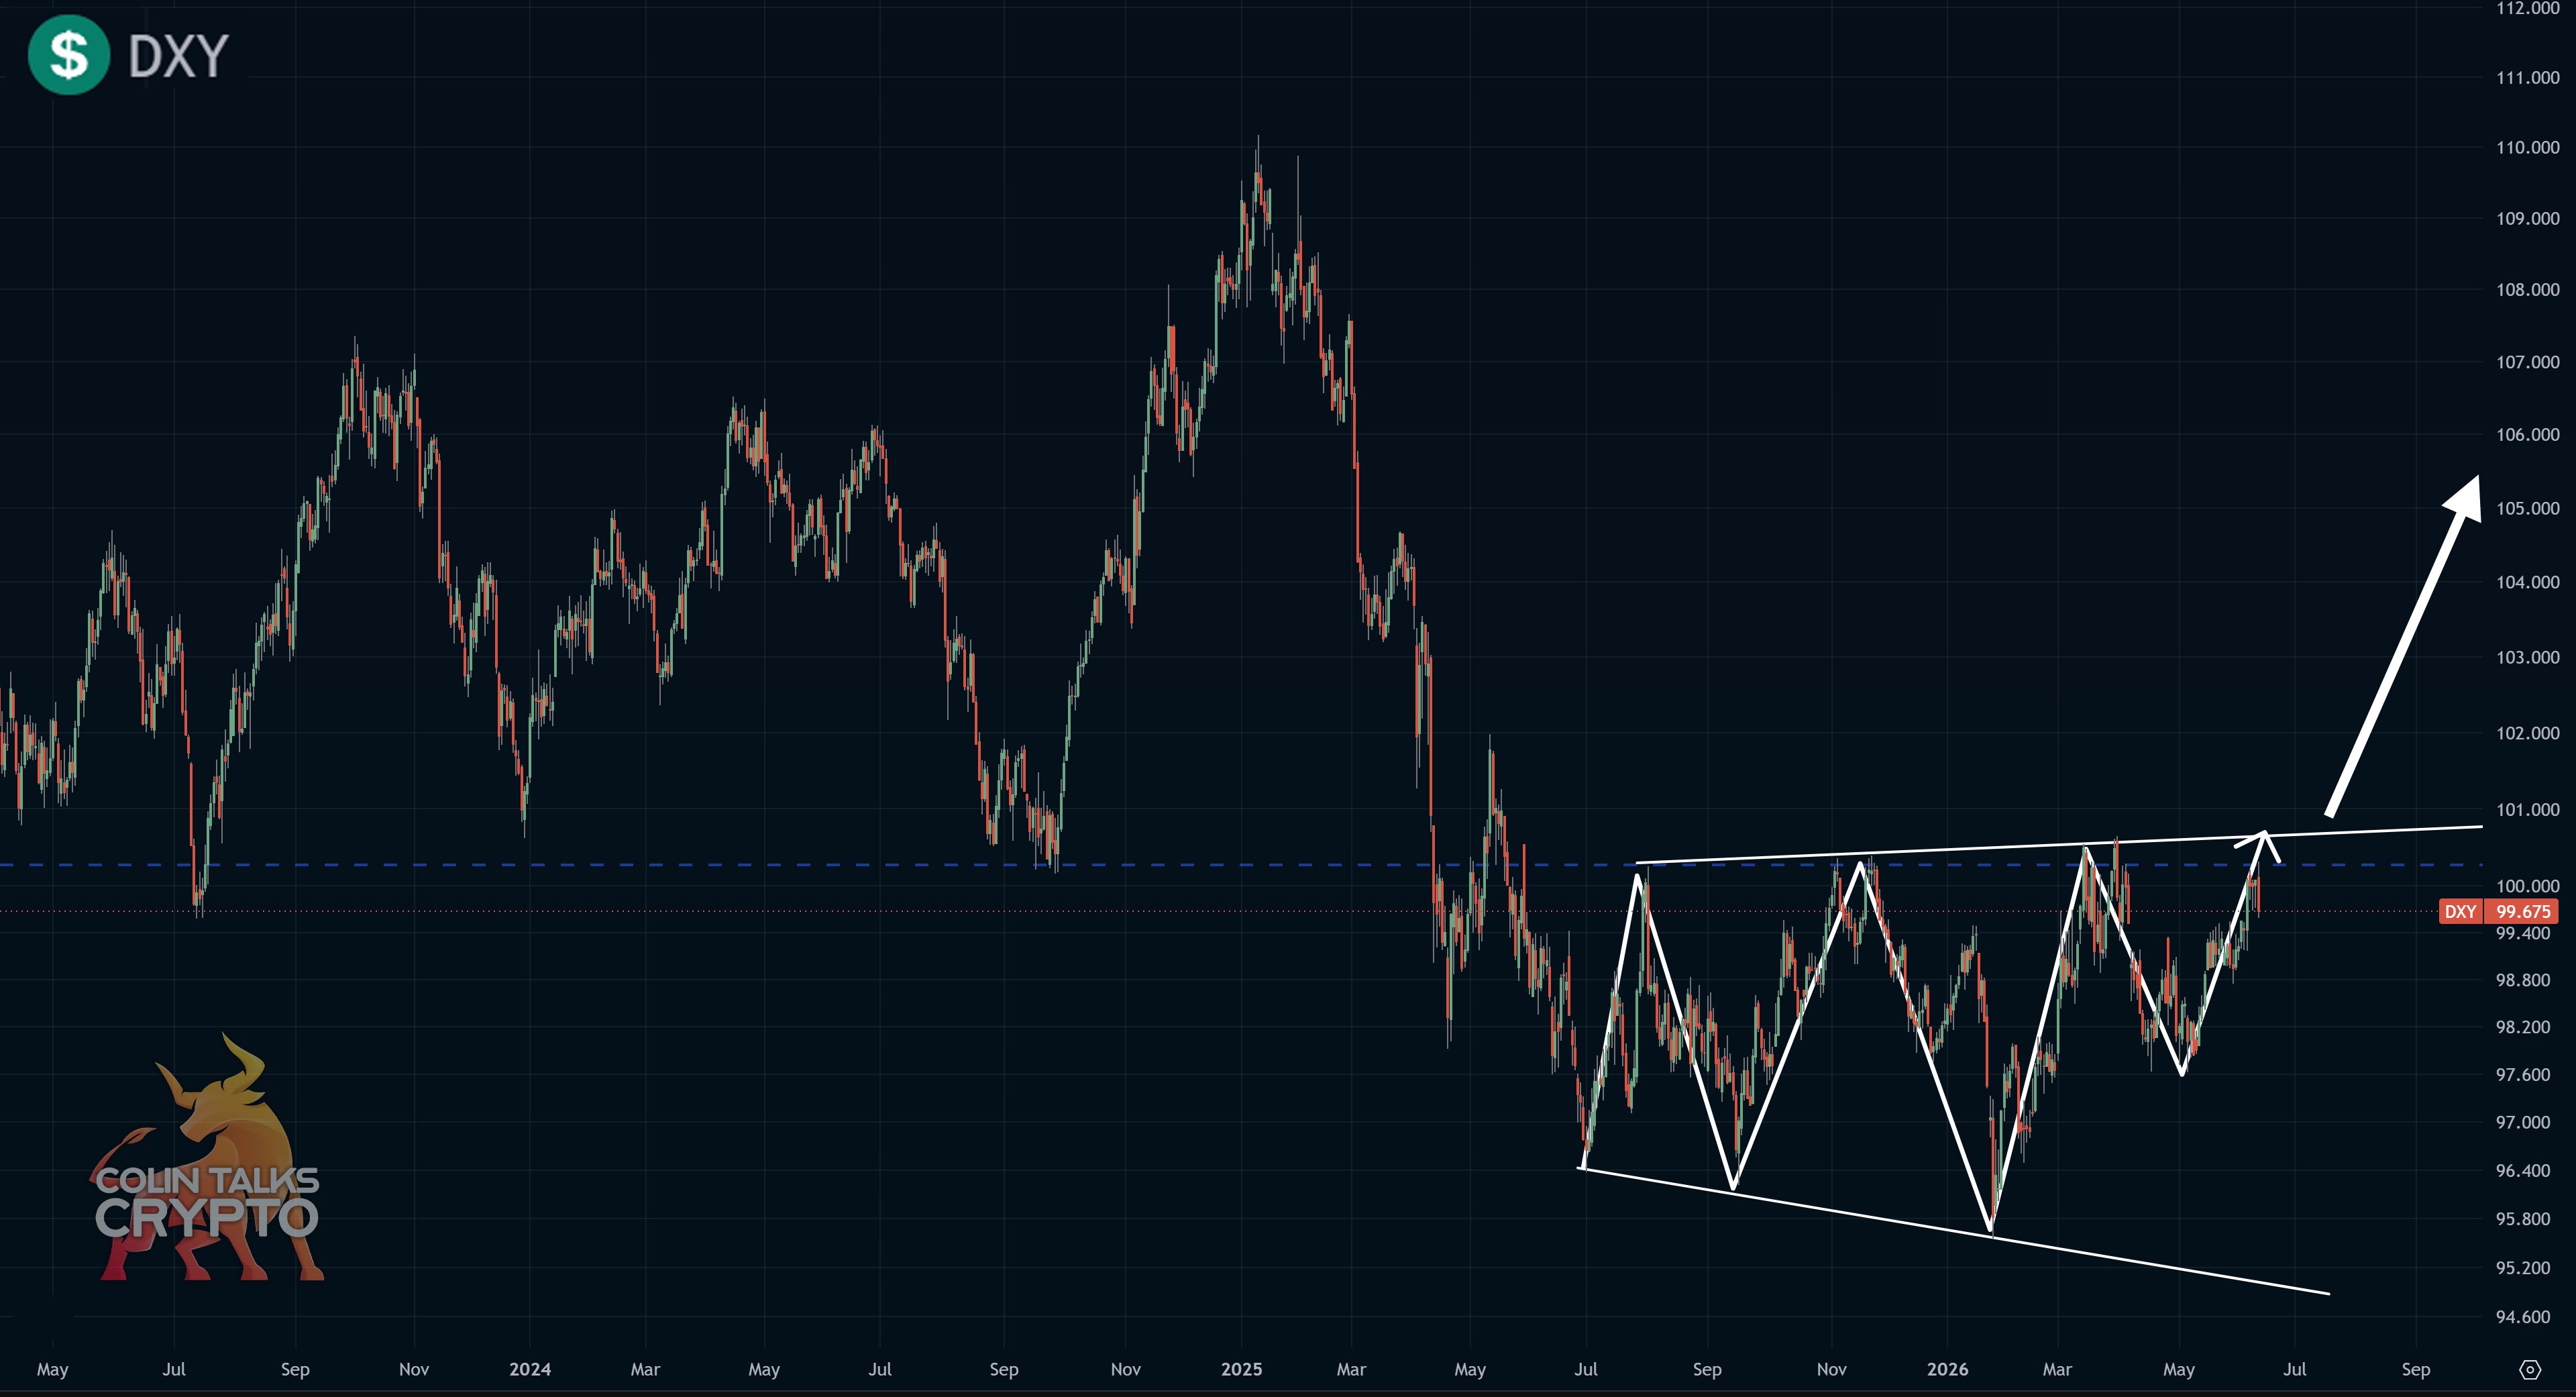
US dollar index (DXY) chart. Source: ColinTalksCrypto/X
Trader Aksel Kibar expected an “important week” for DXY, eyeing the end of a year-long period of consolidation.
Bitcoin continues to circle $64,000 following some brief volatility after the weekly close.
BTC price action eyes July benefits
In his latest market commentary, trader and analyst Rekt Capital had a silver lining for Bitcoin bulls.
Despite the BTC price weakness this month, the historical relationship between the months of June and July means that the pressure may soon ease.
“History suggests that whatever June does, July will do the opposite,” he told X followers this weekend.
“Therefore if June is red, July will likely be green.”
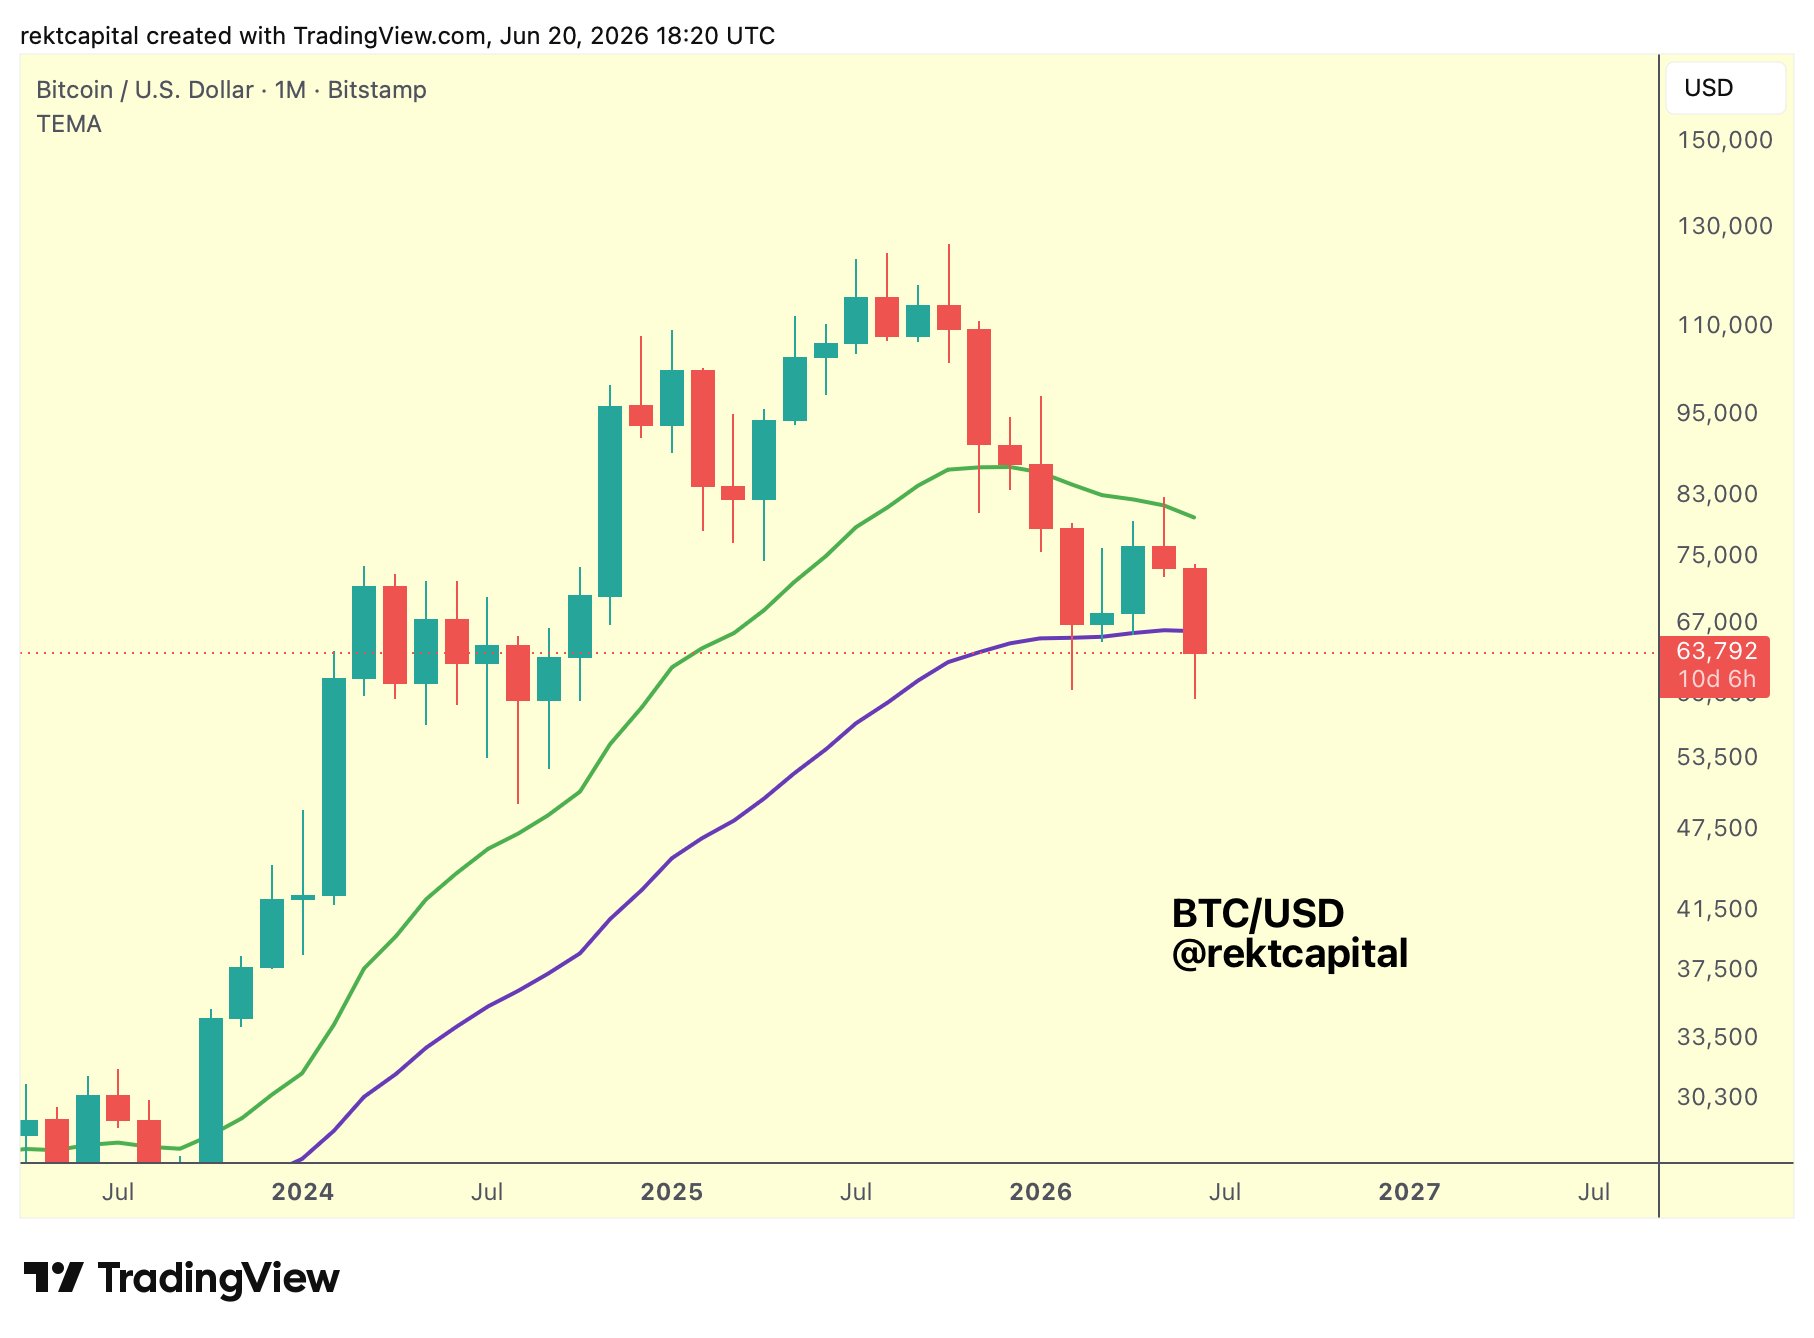
BTC/USD one-month chart with 21, 50EMA. Source: Rekt Capital/X
An accompanying chart showed BTC/USD acting in a range bordered by its 21-month and 50-month EMAs.
“So if June ends the month like this, it will confirm a loss of the 50-Month EMA as support. And so July will likely relief rally to turn the EMA into new resistance,” Rekt Capital added.
That implies that in future, bulls will have to contend with a fresh round of BTC price downside. Earlier, Rekt Capital suggested that the bear market should continue for some months to come, once again based on historical tendencies.
“History suggests there’s still time left and a bit more downside to go,” he reiterated on X while comparing previous bear markets.
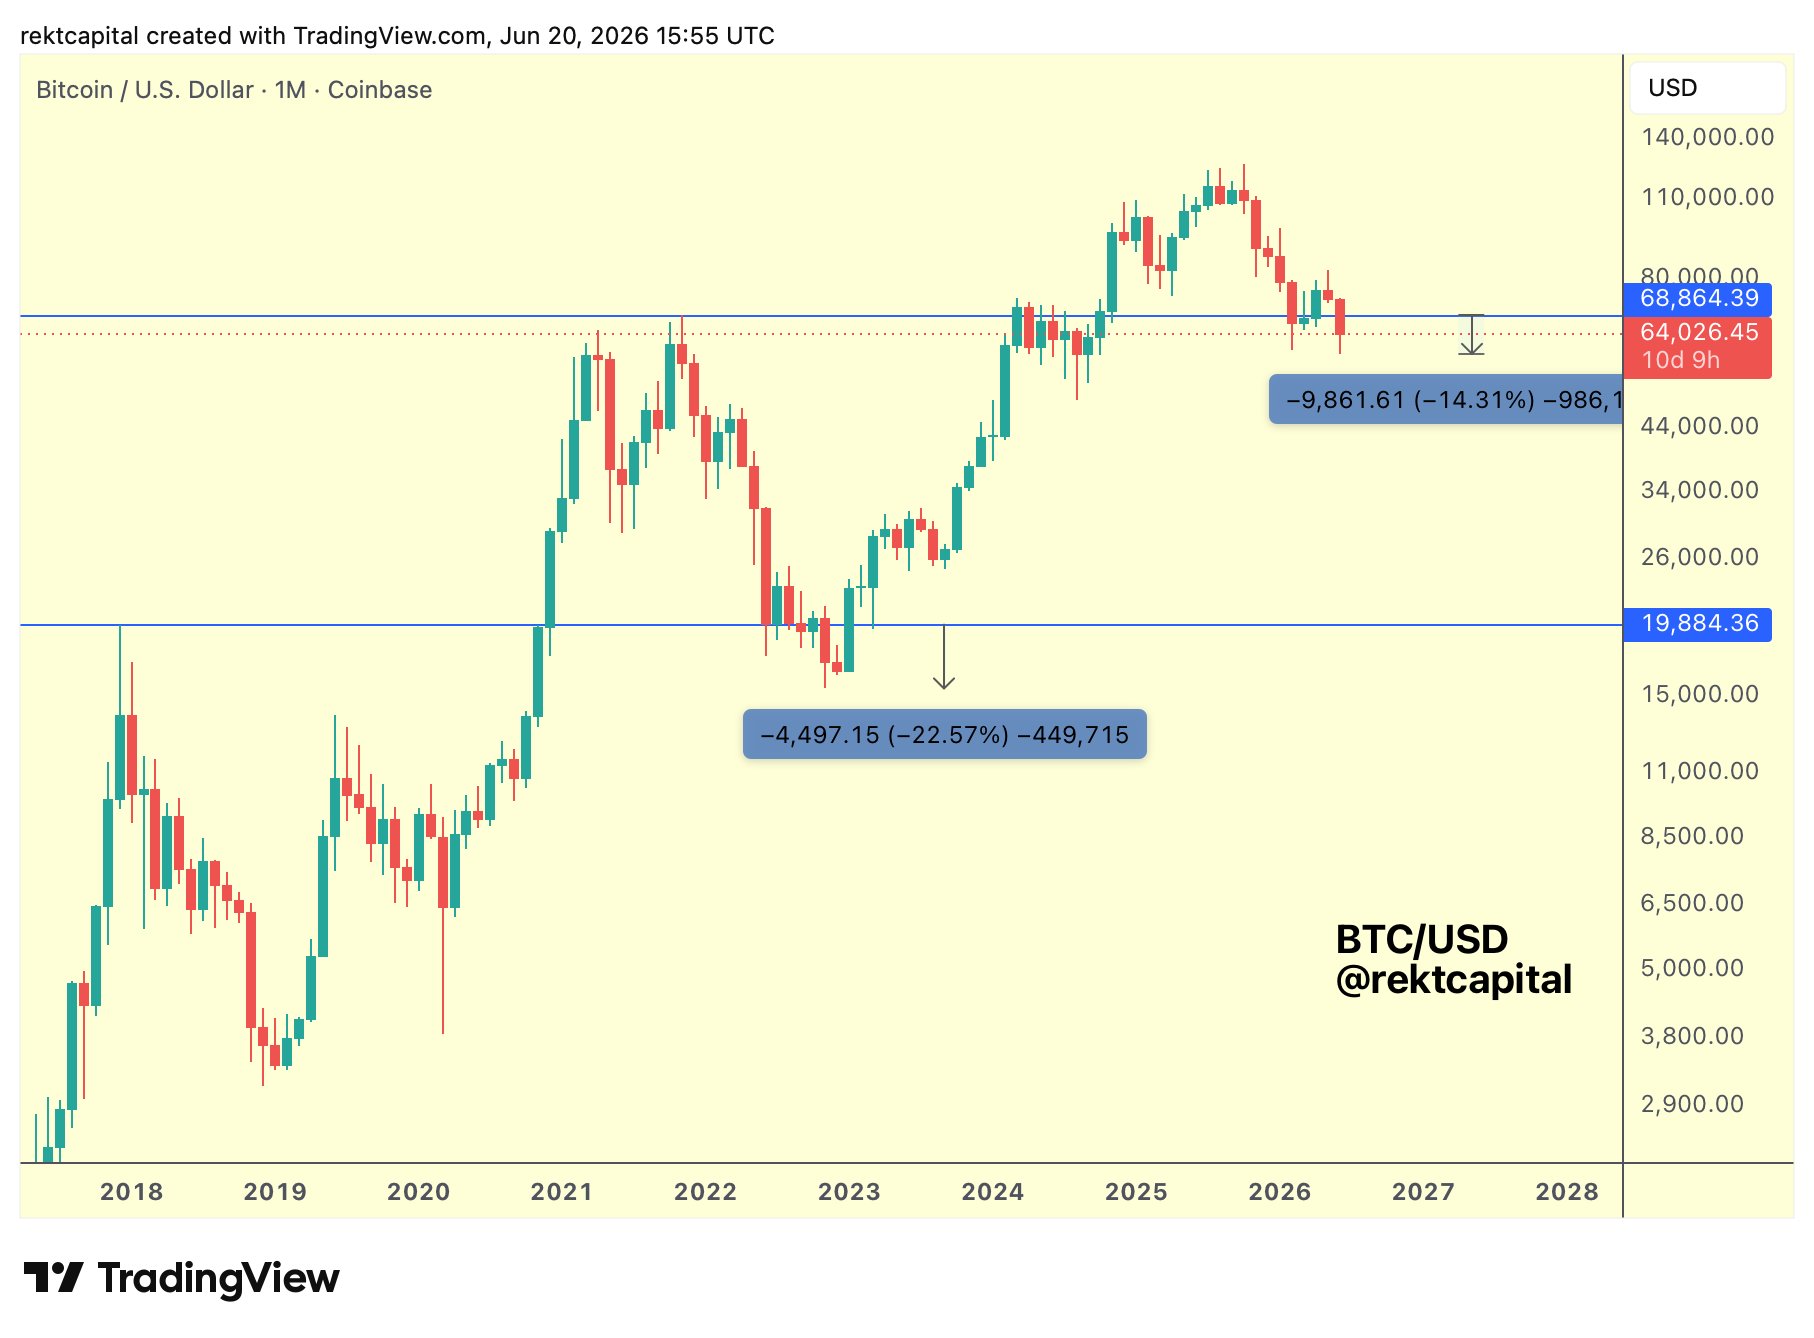
BTC/USD one-month chart. Source: Rekt Capital/X
PCE data due with US-Iran peace under pressure
Inflation remains the firm focus for markets this week as the US Federal Reserve’s “preferred” yardstick leads the macro data releases.
The May print of the Personal Consumption Expenditures (PCE) index is due out on Thursday.
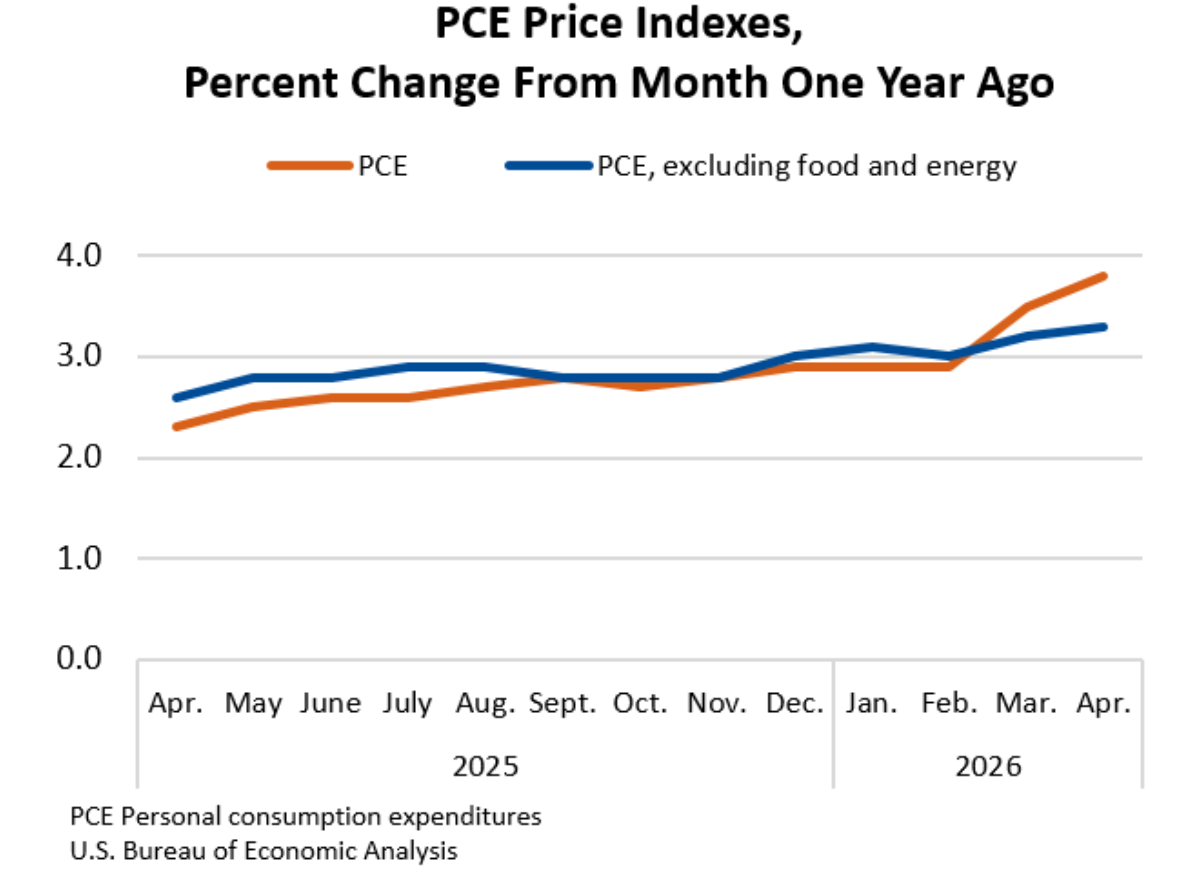
US PCE index % change (screenshot). Source: US Bureau of Economic Analysis
April saw PCE hitting three-year highs, reflecting the ongoing impact of the US-Iran war on inflation trends.
“While investors are hoping that the deal between the U.S. and Iran and corresponding pullback in oil prices will temper inflation, price pressures are spreading beyond energy,” trading resource Mosaic Asset Company wrote in the latest edition of its regular newsletter, The Market Mosaic.
“That’s because multiple catalysts are coming together at the same time to drive a jump in inflation.”
Mosaic highlighted “large” federal budget deficits and supply-chain issues contributing to cost upside.
“Cost increases from energy prices and upheaval following last year’s trade war are likely playing a key role,” it added alongside a chart of Producer Price Index (PPI) data.
“You can see that supply chain pressures tends to lead changes in producer prices.”
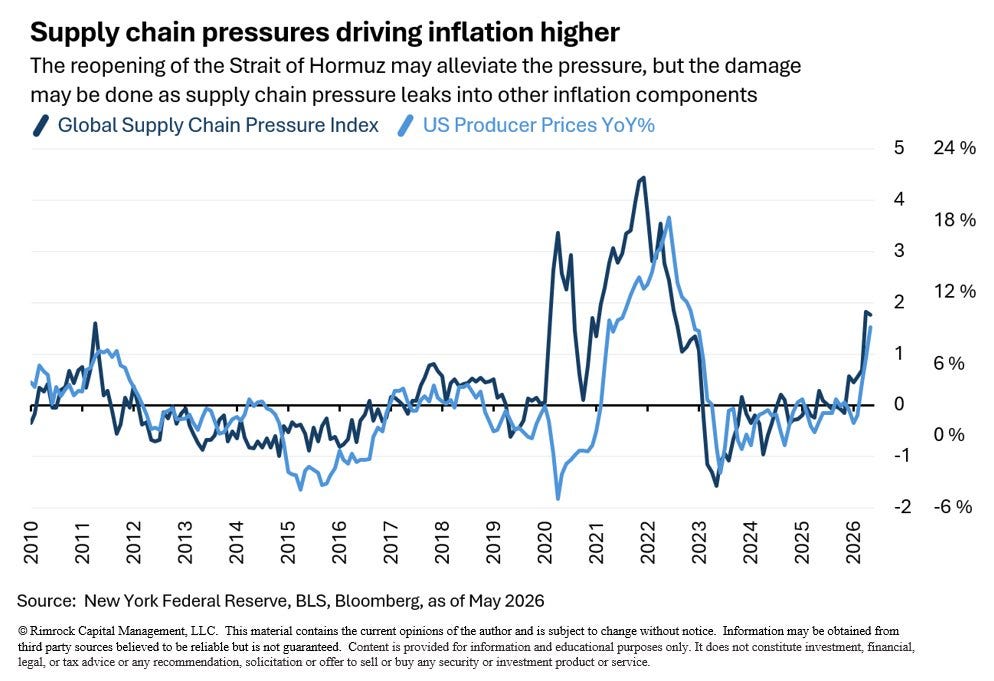
Global supply-chain and PPI data. Source: Mosaic Asset Company
Higher inflation means ostensibly less chance of the Fed cutting interest rates, which in turn creates a headwind for crypto and risk assets. As Cointelegraph reported, markets even see the Fed hiking rates before the end of the year.
The latest data from CME Group’s FedWatch Tool puts the odds of a hike at the Fed’s next meeting in late July at around 36%.
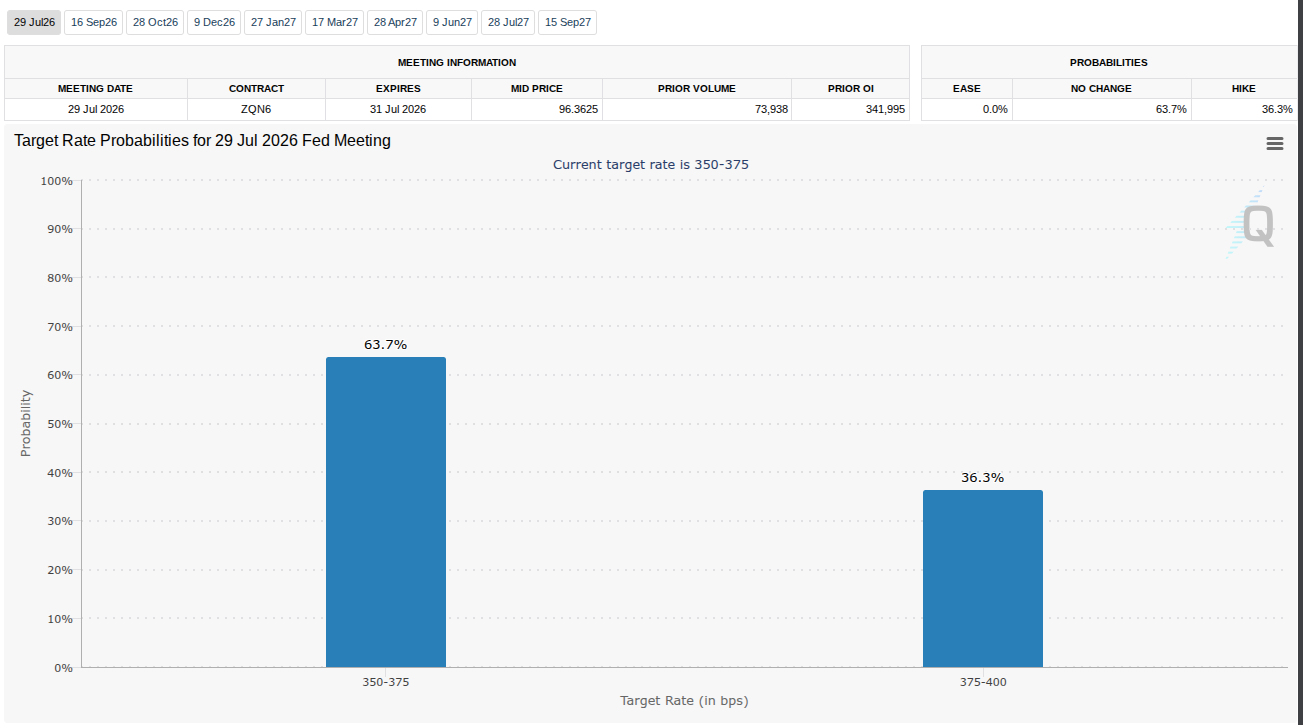
Fed target rate probabilities for July 29 FOMC meeting (screenshot). Source: CME Group
“Concerns over persistently high inflation isn’t the only reason for the Fed to consider hiking interest rates. Recent economic data has been surprising to the upside as well,” Mosaic noted.
Beyond PCE, Thursday will also see revised Q1 GDP data and initial jobless claims.
Oil helps preserve $60,000 support odds
The US-Iran peace deal, despite already showing signs of strain, has had a lasting impact on oil prices.
As the two parties signed it, US WTI crude fell to $73 per barrel, its lowest level since early March and nearly 40% below its local peak.
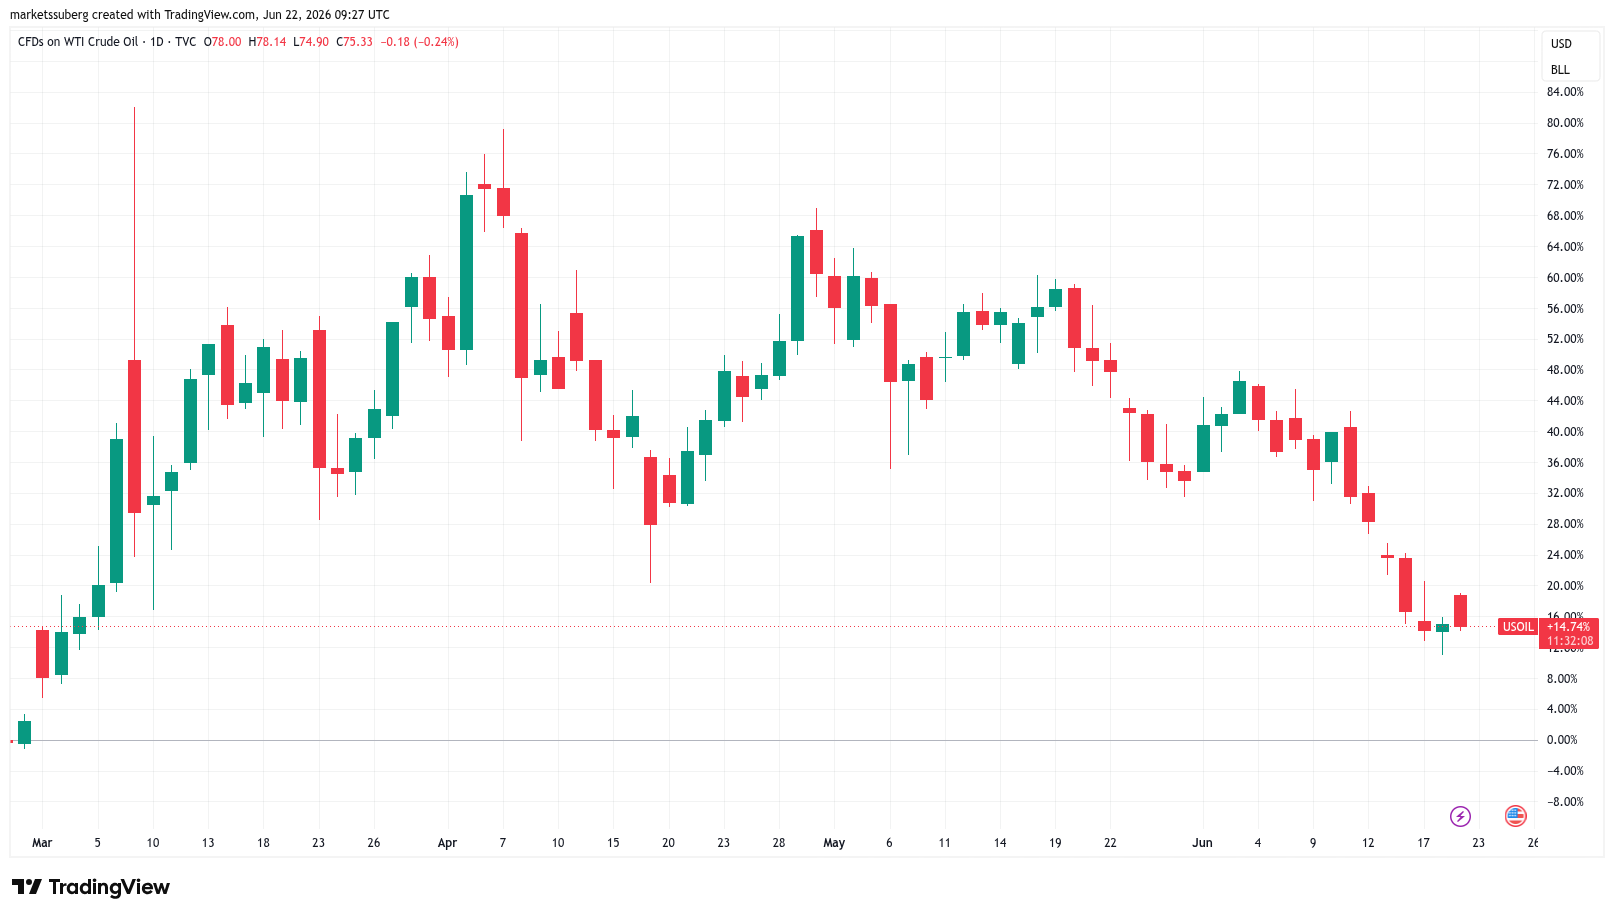
CFDs on US WTI crude oil one-day chart. Source: Cointelegraph/TradingView
Bitcoin has had a broadly inverse correlation to oil. Recent weeks have shown a different relationship in play as risk assets climb, while the peace deal still offers a step up to the mid-$60,000 zone.
Onchain analytics platform Glassnode says it believes that based on oil’s latest moves, there should be cause for Bitcoin bulls to relax in the short term.
“Bitcoin rallied, and also gold rallied,” it said in a video analysis late last week, adding that accumulation trends were helping support $60,000 as a local bottom.
Glassnode described “decent” buying-up of the supply at the lows.
“I believe there’s a chance that this may be a durable bottom, at least to a certain extent — maybe not the absolute bottom, but I think there’s a decent chance that that $60,000 level will be defended by quite a few different cohorts here,” it concluded.
Bitcoin speculators turn “emotional”
As Cointelegraph reported, largest global exchange Binance has been on the radar in recent days thanks to conspicuous Bitcoin selling pressure.
Related: Bitcoin market cap rebound to take ‘5-10 years’ after dropping 10 places since mid-2025
In its latest research, onchain analytics platform CryptoQuant sheds light on the scale of the offload, which notably involves newer investors.
“Once again, it was the STHs who suffered the most from this correction and reacted most sharply,” contributor Darkfost wrote on Sunday.
Darkfost referred to short-term holders (STHs) — investors hodling coins for up to six months. BTC/USD dropping back to February lows, which versus its May peak represented a drop of nearly 30%, resulted in an “emotional” response from the cohort.
“During the month of June, STH inflows on Binance exceeded 80,000 BTC over 7 days, representing approximately $5B in selling pressure,” he reported.
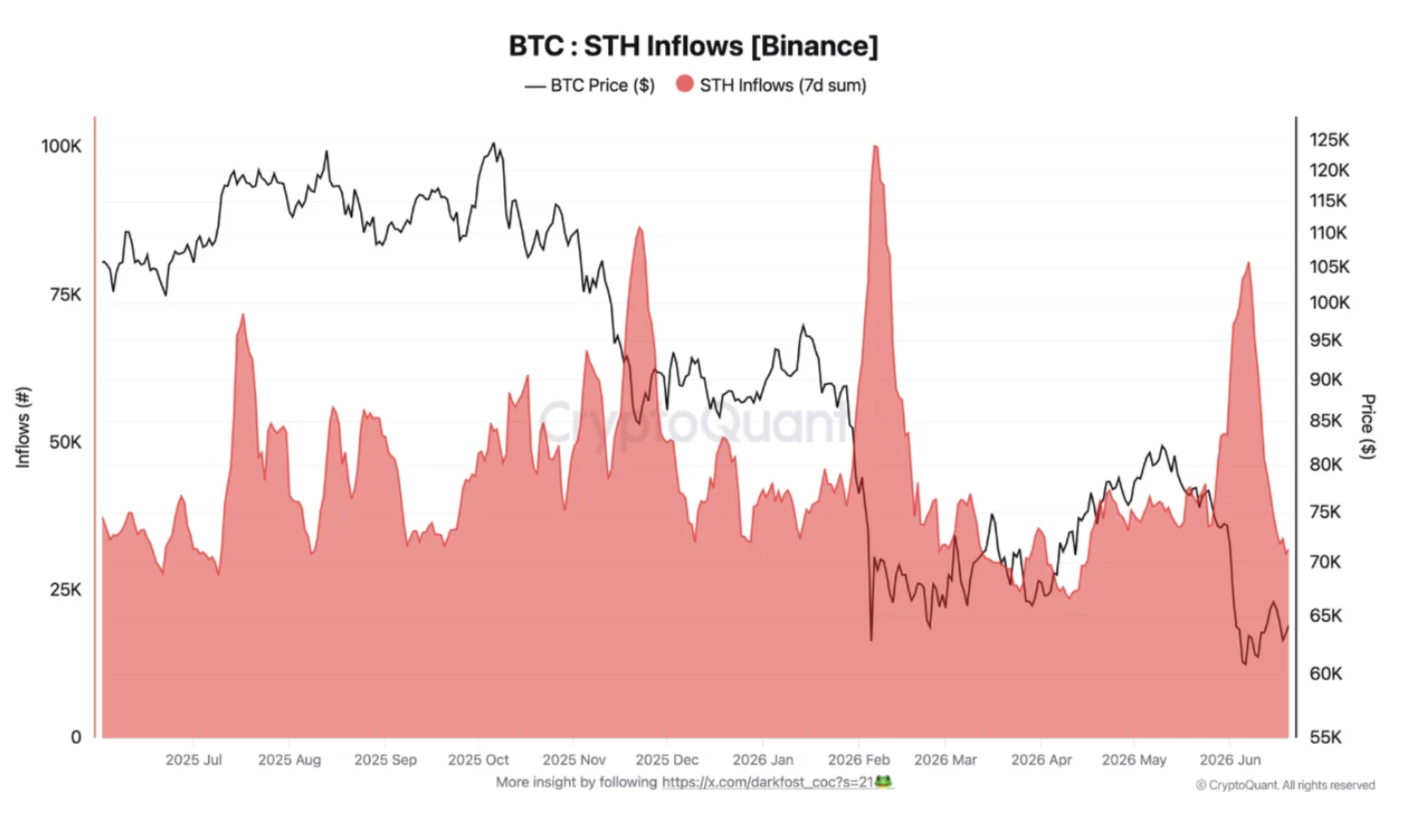
Bitcoin STH inflows (screenshot). Source: CryptoQuant
The impact of the selling has yet to be reflected in the actions of large-volume investors, who remain nonchalant in the current price range. Analyzing the profitability of older and newer Bitcoin whales, CryptoQuant contributor CryptoZeno suggested that the market has found a form of equilibrium.
“The gap between long-term and short-term whale profitability highlights a market transitioning through consolidation rather than capitulation,” they summarized.
“Long-term whales continue to hold positions despite reduced gains, while short-term whales remain largely neutral. This combination often reflects a period of market stabilization where speculative excess is gradually removed from the system.”
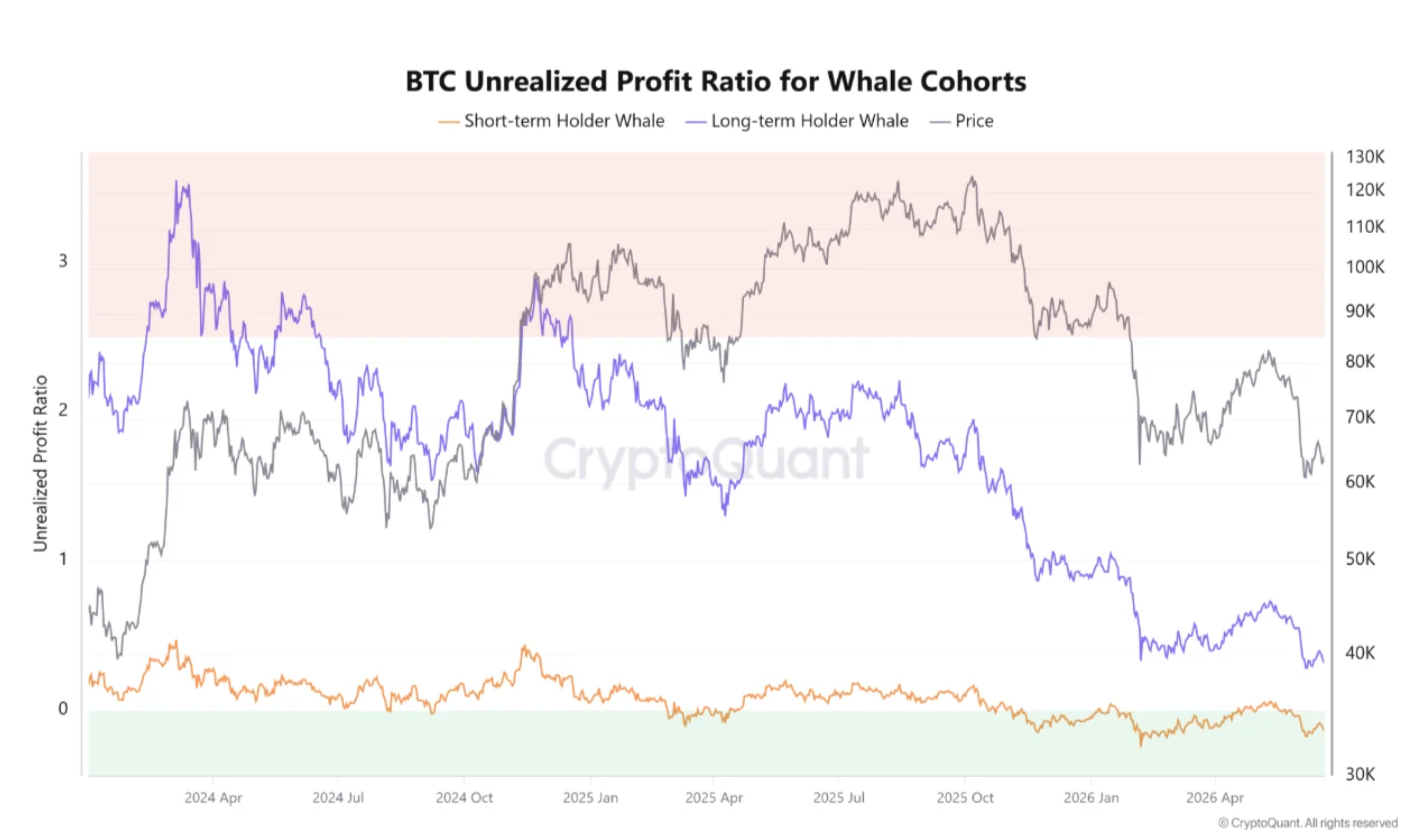
Bitcoin whale unrealized profit ratio (screenshot). Source: CryptoQuant