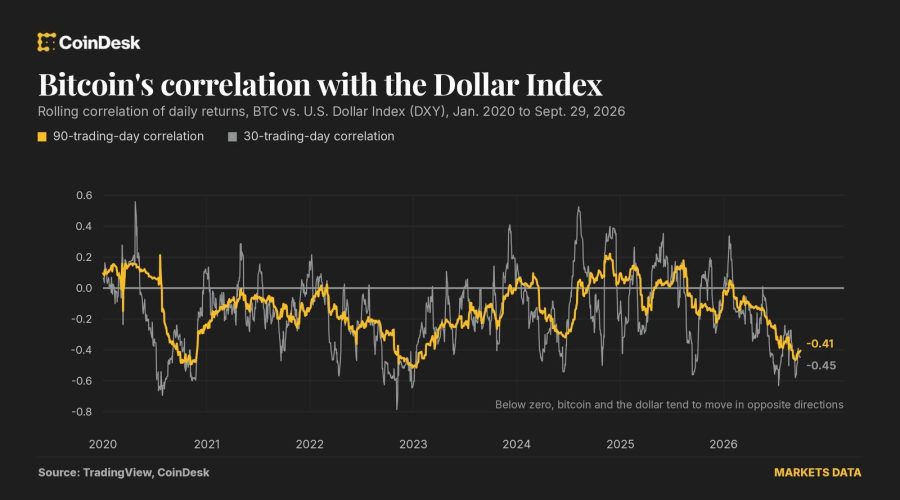
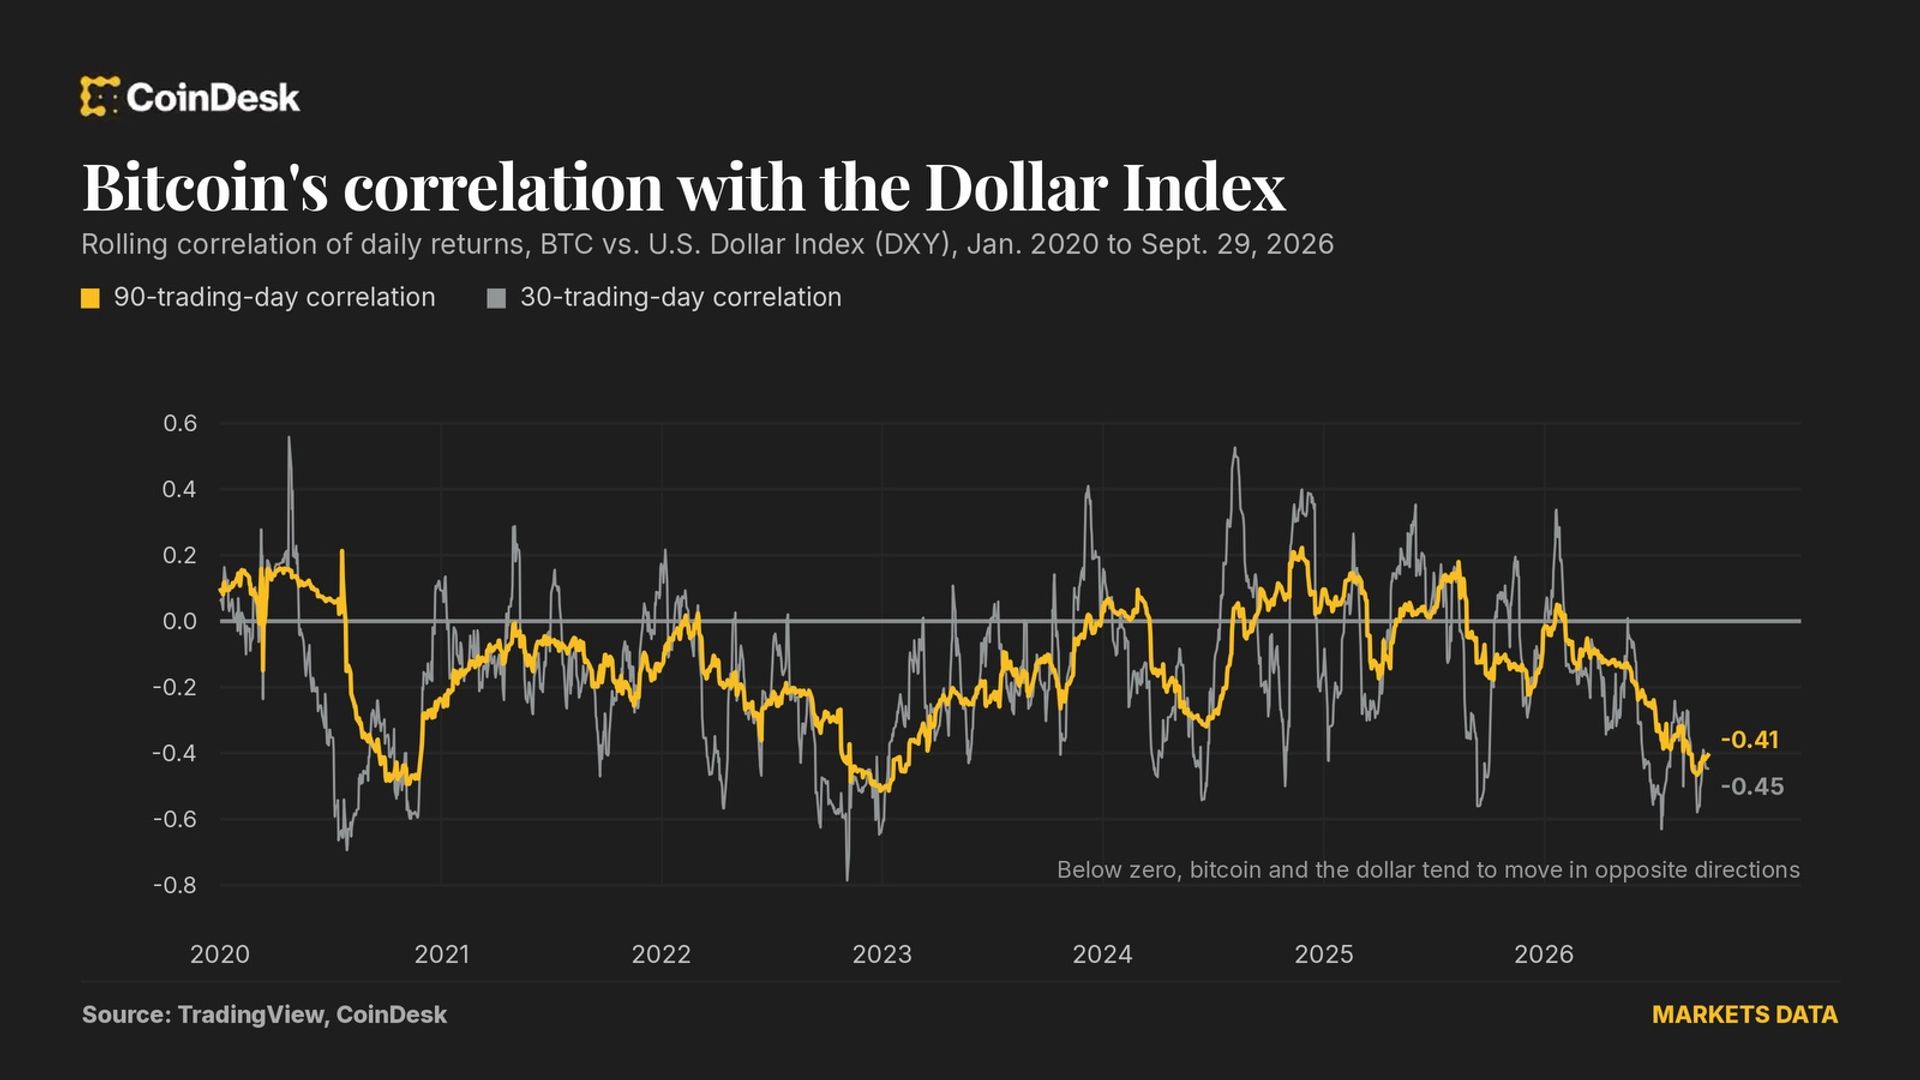
Besides, correlation data backs up that resilience. Over the past 90 trading days, daily moves in BTC and DXY show a correlation of -0.41, according to TradingView data analyzed by CoinDesk. A negative reading means the two tend to move in opposite directions. That is the most negative since February 2023.
However, while the link is real, it is also modest, as the feature image shows. The correlation implies an R-squared of 0.17, meaning DXY accounts for only about 17% of the variation in BTC’s daily returns.
The shorter-term reading is noisier. The 30-day correlation is -0.45, but it leans on two days, Aug. 19 and Sept. 3, when BTC jumped more than 5% as DXY fell. Without them, it drops to -0.19.
Zoom out further and the link looks looser still. Since January 2020, the 90-day correlation has averaged -0.14, and it has turned positive at times, peaking at +0.22 in November 2024.
Bitcoin also shows little notable correlation with U.S. Treasury yields, as CoinDesk discussed recently.
Together with its loose link to the dollar, that supports the case for bitcoin as a portfolio diversifier, an asset that moves largely on its own drivers. Whether that independence lasts is worth watching. Stay alert!